MATLAB: An Introduction with Applications
6th Edition
ISBN: 9781119256830
Author: Amos Gilat
Publisher: John Wiley & Sons Inc
expand_more
expand_more
format_list_bulleted
Question

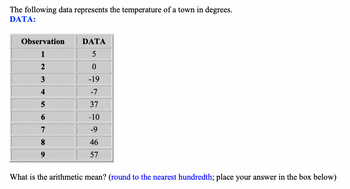
Transcribed Image Text:The following data represents the temperature of a town in degrees.
DATA:
Observation
1
2
3
4
5
6
7
8
9
DATA
5
0
-19
-7
37
-10
-9
46
57
What is the arithmetic mean? (round to the nearest hundredth; place your answer in the box below)
Expert Solution
This question has been solved!
Explore an expertly crafted, step-by-step solution for a thorough understanding of key concepts.
Step by stepSolved in 2 steps

Knowledge Booster
Similar questions
- Complete the table for missing terms Grades # of students Relative Frequency A 16 0.08 B 36 C 90 D F 28arrow_forwardThe ages (in years) and helghts (in inches) of all pitchers for a beseball team are listed. Find the coefficient of variation for each of the two data sets. Then compare the results. -Click the Icon to view the data sets. CV. %D Round to one decimal place as needed.)arrow_forwardDraw a pictograph to represent the data displayed in the table below. Choose whatever symbol you like and be sure to include a key with the scale that you used. Subject Number of Students Math 16 Science 8. English 12 History 8. Art 4 Subject Number of Students Math Science English History Art Key:arrow_forward
- Dr. Seboo has collected the total cholesterol levels of all his patients. He is trying to figure what the typical cholesterol level falls. Use the following output to answer the questions. a. What variable was recorded in the data collected? Classify the variable as categorical or quantitative.Variable: ______________________ Circle one: Categorical or Quantitativeb. Describe the shape of the above distribution:c. The average cholesterol level was _______________, and 50% of this sample cholesterol levels was ________________ or more. The minimum cholesterol level was _______________, while the maximum number cholesterol level was _________________. The middle 50% of cholesterol levels in this sample were between ______________ and ______________. According to _____________________________ Rule, we expect ________% of the cholesterol levels to be between ________________ and _______________ (two standard deviations from the mean).d. Construct a 95% confidence interval for the mean…arrow_forwardHelparrow_forwardFor the data set below, find the IQR. 65 74 74 71 67 72 61 71 60 78 78 Send data to Excel 60 065 74 05 Continuearrow_forward
- Complete the table to the right. Grade on Business Statistics Exam Frequency Relative Frequency A: 90-100 0.08 B: 80-89 C: 65-79 69 111 D: 50-64 54 F: Below 50 42 Total 300 1.00 Grade on Business Statistics Exam Frequency Relative Frequency A: 90-100 24 0.08 B: 80-89 69arrow_forwardFor the data in the table, find the mean and the median of the monthly high temperatures. Then do the same for the monthly low temperatures. The mean of the high temperatures is ______F (type an integer or a decimal.) Month High low Jan 17 8 Feb 23 13 Mar 30 19 Temperatures are in degrees fahrenheit Apr 41 28 May 54 43arrow_forwardFind the mean for the list of numbers. Ages of patients (in years ) in a clinic: 15, 4, 22, 15 Round answer to the nearest whole number if necessary.arrow_forward
- Helparrow_forwardJessica counts how many customers have come into her restaurant for the past 30 days. The table below shows the number of customers per day. 135 137 136 137 138 139 140 139 137 140 142 146 148 145 139 140 142 143 144 143 141 139 137 138 139 136 133 134 132 132 She would like you to create a histogram for her starting at 130 with a bin width of 5. Which bar is the tallest? The first bar The second bar The third bar The fourth bararrow_forward7. Describe the shape of your data set by looking at the histogram. In your histogram how many classes are there? What is the class width?arrow_forward
arrow_back_ios
SEE MORE QUESTIONS
arrow_forward_ios
Recommended textbooks for you
 MATLAB: An Introduction with ApplicationsStatisticsISBN:9781119256830Author:Amos GilatPublisher:John Wiley & Sons Inc
 Probability and Statistics for Engineering and th...StatisticsISBN:9781305251809Author:Jay L. DevorePublisher:Cengage Learning
 Statistics for The Behavioral Sciences (MindTap C...StatisticsISBN:9781305504912Author:Frederick J Gravetter, Larry B. WallnauPublisher:Cengage Learning
 Elementary Statistics: Picturing the World (7th E...StatisticsISBN:9780134683416Author:Ron Larson, Betsy FarberPublisher:PEARSON
 The Basic Practice of StatisticsStatisticsISBN:9781319042578Author:David S. Moore, William I. Notz, Michael A. FlignerPublisher:W. H. Freeman
 Introduction to the Practice of StatisticsStatisticsISBN:9781319013387Author:David S. Moore, George P. McCabe, Bruce A. CraigPublisher:W. H. Freeman

MATLAB: An Introduction with Applications
Statistics
ISBN:9781119256830
Author:Amos Gilat
Publisher:John Wiley & Sons Inc

Probability and Statistics for Engineering and th...
Statistics
ISBN:9781305251809
Author:Jay L. Devore
Publisher:Cengage Learning

Statistics for The Behavioral Sciences (MindTap C...
Statistics
ISBN:9781305504912
Author:Frederick J Gravetter, Larry B. Wallnau
Publisher:Cengage Learning

Elementary Statistics: Picturing the World (7th E...
Statistics
ISBN:9780134683416
Author:Ron Larson, Betsy Farber
Publisher:PEARSON

The Basic Practice of Statistics
Statistics
ISBN:9781319042578
Author:David S. Moore, William I. Notz, Michael A. Fligner
Publisher:W. H. Freeman

Introduction to the Practice of Statistics
Statistics
ISBN:9781319013387
Author:David S. Moore, George P. McCabe, Bruce A. Craig
Publisher:W. H. Freeman