
MATLAB: An Introduction with Applications
6th Edition
ISBN: 9781119256830
Author: Amos Gilat
Publisher: John Wiley & Sons Inc
expand_more
expand_more
format_list_bulleted
Related questions
Question
thumb_up100%
The following data represent the pH of rain for a random sample of 12 rain dates. A normal probability plot suggests the data could come from a population that is normally distributed. A boxplot indicates there are no outliers.
C) Construct and interpret a 99% confidence interval for the mean pH of rainwater.
(Use the ascending order. Round to two decimal places as needed.)
There is 99% confidence that the population mean pH of rain water is between ___ and ___.
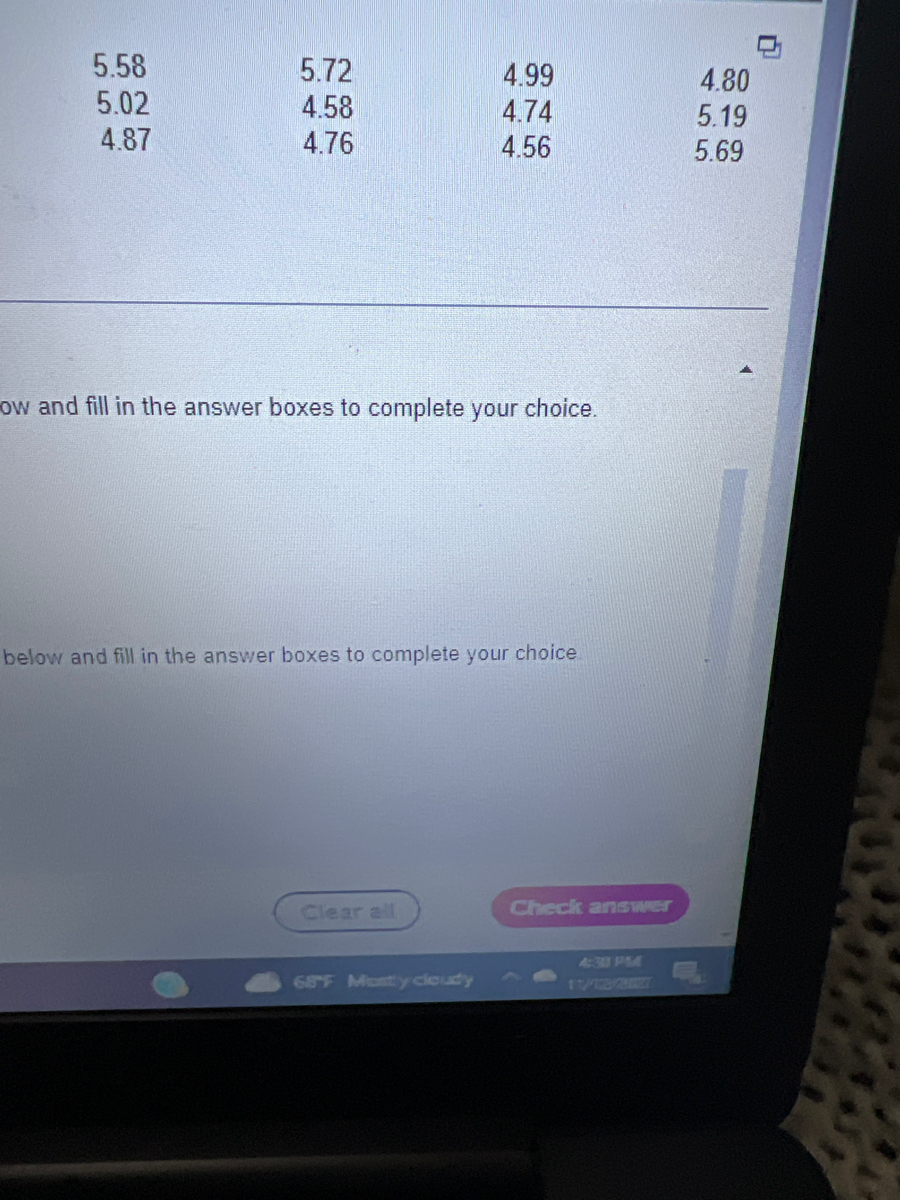

Transcribed Image Text:The image shows a table with numerical data and a snippet of an online educational platform interface.
**Table Data:**
- **Column 1:** 5.58, 5.02, 4.87
- **Column 2:** 5.72, 4.58, 4.76
- **Column 3:** 4.99, 4.74, 4.56
- **Column 4:** 4.80, 5.19, 5.69
**Interface Elements:**
- There is a message prompting users to complete their choice by filling in answer boxes.
- A clear visual button is present for users to "Check answer."
- An option to "Clear all" inputs is available.
**Additional Information:**
- The bottom portion of the interface shows the current temperature and weather condition, indicating "68°F" and "Mostly cloudy."
- The time and date displayed on the interface are "4:38 PM" and "1/15/2022."
Expert Solution
This question has been solved!
Explore an expertly crafted, step-by-step solution for a thorough understanding of key concepts.

This is a popular solution

Trending nowThis is a popular solution!

Step by stepSolved in 4 steps with 2 images

Knowledge Booster

Similar questions
- Provide the confidence interval that are missingarrow_forward3. Given the following GPA for 4 students: 2, 3, 3, 4. Age of students are: 10, 11,12, 15. There are 10,000 total students. Average GPA: Unknown, StandardDeviation of GPA: 0.02 and it’s Normal.a. Find the mean and standard deviation for GPA.b. Calculate a 95% confidence interval for the populations mean GPA.c. Use Correlation formula to find r between GPA and Age.d. Find Regression Line Equation.e. If a student’s age is 13, what is the corresponding GPA?arrow_forwardAnswer A B Carrow_forward
- Tina catches a 14-pound bass. She does not know the population mean or standard deviation. So she takes a sample of five friends and they say the last bass they caught was 9, 12, 13, 10, and 10 pounds. Find the t and calculate a 95% (α = .05) confidence interval.arrow_forwardThe weight of items produced by a machine is normally distributed with a mean of 8 ounces and a standard deviation of 2 ounces.Refer to Exhibit 6-5. What is the random variable in this experiment? a. 8 ounces b. Weight of items produced by a machine c. Normal distribution d. 2 ouncesarrow_forwardGiven below are the sodium contents in milligrams for seven brands of hot dogs rated as “very good” by Consumer Reports. Find a 99.9% confidence interval for the true mean amount of sodium for “very good” hotdogs. 400 470 350 365 270 550 530arrow_forward
- Furnace repair bills are normally distributed with a mean of 271 dollars and a standard deviation of 20 dollars. If 64 of these repair bills are randomly selected, find the probability that they have a mean cost between 271 dollars and 273 dollars. Round to four decimal places. A. 0.2881 OB. 0.2119 O C. 0.5517 O D. 0.7881arrow_forwardThe following data represent a random sample of five measurements from a normally distributed population: 7,4,2,5,7 a. Find 90% confidence interval for u. b. Find a 99% confidence interval for u.arrow_forwardResearchers studied the mean egg length (in millimeters) for a bird population. After taking a random sample of eggs, they obtained a 95% confidence interval of (45,60). What is the value of the margin of error? Choose the correct answer below. A. 15 mm B. 52.5 mm O c. 7.5 mm O D. 1.96arrow_forward
arrow_back_ios
arrow_forward_ios
Recommended textbooks for you
- MATLAB: An Introduction with ApplicationsStatisticsISBN:9781119256830Author:Amos GilatPublisher:John Wiley & Sons Inc
 Probability and Statistics for Engineering and th...StatisticsISBN:9781305251809Author:Jay L. DevorePublisher:Cengage Learning
 Statistics for The Behavioral Sciences (MindTap C...StatisticsISBN:9781305504912Author:Frederick J Gravetter, Larry B. WallnauPublisher:Cengage Learning
  Elementary Statistics: Picturing the World (7th E...StatisticsISBN:9780134683416Author:Ron Larson, Betsy FarberPublisher:PEARSON
 The Basic Practice of StatisticsStatisticsISBN:9781319042578Author:David S. Moore, William I. Notz, Michael A. FlignerPublisher:W. H. Freeman
 Introduction to the Practice of StatisticsStatisticsISBN:9781319013387Author:David S. Moore, George P. McCabe, Bruce A. CraigPublisher:W. H. Freeman
MATLAB: An Introduction with Applications
Statistics
ISBN:9781119256830
Author:Amos Gilat
Publisher:John Wiley & Sons Inc
Probability and Statistics for Engineering and th...
Statistics
ISBN:9781305251809
Author:Jay L. Devore
Publisher:Cengage Learning
Statistics for The Behavioral Sciences (MindTap C...
Statistics
ISBN:9781305504912
Author:Frederick J Gravetter, Larry B. Wallnau
Publisher:Cengage Learning
Elementary Statistics: Picturing the World (7th E...
Statistics
ISBN:9780134683416
Author:Ron Larson, Betsy Farber
Publisher:PEARSON
The Basic Practice of Statistics
Statistics
ISBN:9781319042578
Author:David S. Moore, William I. Notz, Michael A. Fligner
Publisher:W. H. Freeman
Introduction to the Practice of Statistics
Statistics
ISBN:9781319013387
Author:David S. Moore, George P. McCabe, Bruce A. Craig
Publisher:W. H. Freeman