
A First Course in Probability (10th Edition)
10th Edition
ISBN: 9780134753119
Author: Sheldon Ross
Publisher: PEARSON
expand_more
expand_more
format_list_bulleted
Related questions
Question
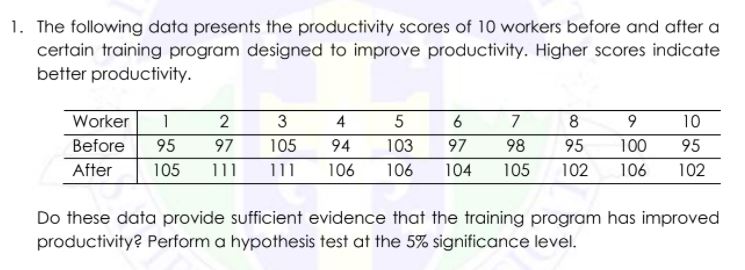

Transcribed Image Text:1. The following data presents the productivity scores of 10 workers before and after a
certain training program designed to improve productivity. Higher scores indicate
better productivity.
Worker
3
4
5
7
8
10
Before
95
97
105
94
103
97
98
95
100
95
After
105
111
111
106
106
104
105
102
106
102
Do these data provide sufficient evidence that the training program has improved
productivity? Perform a hypothesis test at the 5% significance level.
Expert Solution
This question has been solved!
Explore an expertly crafted, step-by-step solution for a thorough understanding of key concepts.

This is a popular solution

Trending nowThis is a popular solution!

Step by stepSolved in 2 steps with 1 images

Knowledge Booster

Similar questions
- Here is a set of data. 11 199 208 352 418 628 788 792 821 937 946 972 Identify the 5 number summary (min, Q1, median, Q3, max)arrow_forwardmpute Marshall – Edgeworth price index number for the following data by taking 2016 as base year. Items sold out in a men's wear 2017. 2016 GRSH Prices Quantity Quantity Prices Shirts 900 175 700 150 Pants 1200 150 1000 100 Sandals 600 100 500 70 Shoes 1800 60 1500 50 150 Belts Watches 400 100 600 250 300 1500 1200arrow_forwardHere is a set of 29 data values 3 150 205 220 222 246 392 481 484 493 530 582 589 613 618 625 663 693 707 711 730 753 768 773 799 810 824 876 953 Base on the data above, identify the 5 number summary (min, Q1, median, Q3, max).arrow_forward
- All companies are rightly concerned about the income disparity between Males and Females and FringeTech is no different. Is there any evidence in the data that Males are earning more than Females on average? Gender Income ($000) F 94.1 F 69.4 F 81.7 F 72.1 F 90.1 F 84.4 F 77.5 F 124 F 71.2 F 72.1 F 75.7 F 79.8 F 76.7 F 65.1 F 83.8 F 85.8 F 70.6 F 93.3 F 80.1 F 80.8 F 85.5 F 62.1 F 88.5 F 88.2 F 110.3 F 124.6 F 97.6 F 82.4 F 58.2 F 75.5 F 75.1 F 70.5 F 83.9 F 95.5 F 150.2 F 84.4 F 88.7 F 135.4 F 72.3 F 65.5 F 80.3 F 136.8 F 75.8 F 47.5 F 86.6 F 64.4 F 99.3 F 40 F 69.1 F 107.7 F 74.7 F 90.3 F 82.2 F 97 F 125.3 F 111.1 F 60.4 F 102.7 F 89 F 69.4 F 61.6 F 93.1 F 87.2 F 67.7 F 130.6 F 83.2 F 50.4 F 132.7 F 69.1 F 103.6 F 80.2 F 73.9 F 56.3 F 130.2 F 80.7 M 83.1 M 95.4 M 128.2 M 127.3 M 96.8 M 94 M 125.5 M 107.2 M 92.4 M…arrow_forwardThe following data represent the monthly phone use, in minutes, of a customer enrolled in a fraud prevention program for the past 20 months. The phone company decides to use the upper fence ad the cutoff point for the number of minutes at which the customer should be contacted. What is the cutoff point?arrow_forwardHere is a set of data. 96 166 199 200 236 238 242 250 295 477 485 508 597 786 804 903 990 Identify the 5 number summary (min, Q1, median, Q3, max)arrow_forward
arrow_back_ios
arrow_forward_ios
Recommended textbooks for you
- A First Course in Probability (10th Edition)ProbabilityISBN:9780134753119Author:Sheldon RossPublisher:PEARSON

A First Course in Probability (10th Edition)
Probability
ISBN:9780134753119
Author:Sheldon Ross
Publisher:PEARSON