
MATLAB: An Introduction with Applications
6th Edition
ISBN: 9781119256830
Author: Amos Gilat
Publisher: John Wiley & Sons Inc
expand_more
expand_more
format_list_bulleted
Related questions
Question
Q10. Please help
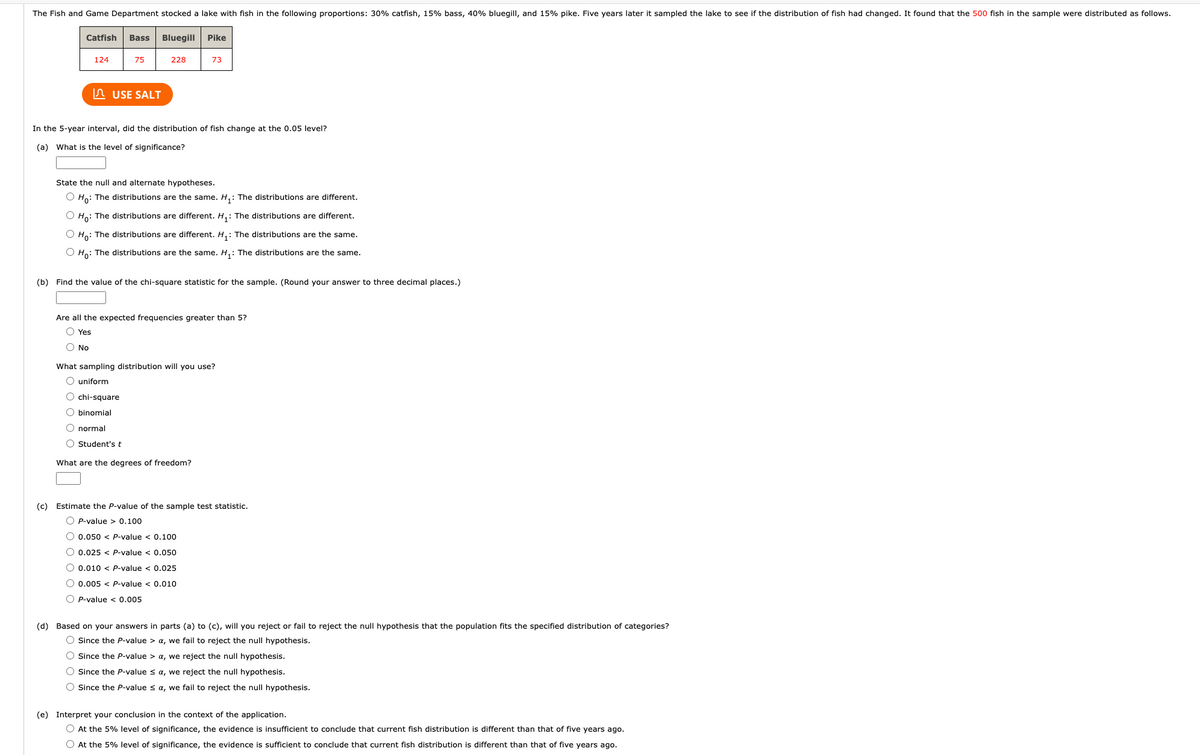

Transcribed Image Text:The Fish and Game Department stocked a lake with fish in the following proportions: 30% catfish, 15% bass, 40% bluegill, and 15% pike. Five years later it sampled the lake to see if the distribution of fish had changed. It found that the 500 fish in the sample were distributed as follows.
Catfish Bass Bluegill Pike
124
75
228
73
USE SALT
In the 5-year interval, did the distribution of fish change at the 0.05 level?
(a) What is the level of significance?
State the null and alternate hypotheses.
O Ho: The distributions are the same. H₁: The distributions are different.
O Ho: The distributions are different. H₁: The distributions are different.
O Ho: The distributions are different. H₁: The distributions are the same.
O Ho: The distributions are the same. H₁: The distributions are the same.
(b) Find the value of the chi-square statistic for the sample. (Round your answer to three decimal places.)
Are all the expected frequencies greater than 5?
Yes
O No
What sampling distribution will you use?
O uniform
O chi-square
O binomial
O normal
O Student's t
What are the degrees of freedom?
(c) Estimate the P-value of the sample test statistic.
OP-value > 0.100
O 0.050 < P-value < 0.100
O 0.025 < P-value < 0.050
0.010 < P-value < 0.025
O 0.005 < P-value < 0.010
OP-value < 0.005
(d) Based on your answers in parts (a) to (c), will you reject or fail to reject the null hypothesis that the population fits the specified distribution of categories?
O Since the P-value > a, we fail to reject the null hypothesis.
O Since the P-value > a, we reject the null hypothesis.
O Since the P-value ≤ a, we reject the null hypothesis.
O Since the P-value ≤ a, we fail to reject the null hypothesis.
(e) Interpret your conclusion in the context of the application.
O At the 5% level of significance, the evidence is insufficient to conclude that current fish distribution is different than that of five years ago.
O At the 5% level of significance, the evidence is sufficient to conclude that current fish distribution is different than that of five years ago.
Expert Solution
This question has been solved!
Explore an expertly crafted, step-by-step solution for a thorough understanding of key concepts.

This is a popular solution

Trending nowThis is a popular solution!

Step by stepSolved in 2 steps with 1 images

Knowledge Booster

Similar questions
- distrib 0.2061 OKarrow_forward3x + 5y = 32.75 4x + 4y = 29arrow_forwardThe following data, reproduced from Table 3.8 of Example 3-14, give the frequency distri- bution of the daily commuting times (in minutes) from home to work for all 25 employees of a company. Daily Commuting Time (minutes) 0 to less than 10 10 to less than 20 20 to less than 30 30 to less than 40 40 to less than 50 Calculate the variance and standard deviation. Number of Employees 49642arrow_forward
arrow_back_ios
arrow_forward_ios
Recommended textbooks for you
- MATLAB: An Introduction with ApplicationsStatisticsISBN:9781119256830Author:Amos GilatPublisher:John Wiley & Sons Inc
 Probability and Statistics for Engineering and th...StatisticsISBN:9781305251809Author:Jay L. DevorePublisher:Cengage Learning
 Statistics for The Behavioral Sciences (MindTap C...StatisticsISBN:9781305504912Author:Frederick J Gravetter, Larry B. WallnauPublisher:Cengage Learning
  Elementary Statistics: Picturing the World (7th E...StatisticsISBN:9780134683416Author:Ron Larson, Betsy FarberPublisher:PEARSON
 The Basic Practice of StatisticsStatisticsISBN:9781319042578Author:David S. Moore, William I. Notz, Michael A. FlignerPublisher:W. H. Freeman
 Introduction to the Practice of StatisticsStatisticsISBN:9781319013387Author:David S. Moore, George P. McCabe, Bruce A. CraigPublisher:W. H. Freeman
MATLAB: An Introduction with Applications
Statistics
ISBN:9781119256830
Author:Amos Gilat
Publisher:John Wiley & Sons Inc
Probability and Statistics for Engineering and th...
Statistics
ISBN:9781305251809
Author:Jay L. Devore
Publisher:Cengage Learning
Statistics for The Behavioral Sciences (MindTap C...
Statistics
ISBN:9781305504912
Author:Frederick J Gravetter, Larry B. Wallnau
Publisher:Cengage Learning
Elementary Statistics: Picturing the World (7th E...
Statistics
ISBN:9780134683416
Author:Ron Larson, Betsy Farber
Publisher:PEARSON
The Basic Practice of Statistics
Statistics
ISBN:9781319042578
Author:David S. Moore, William I. Notz, Michael A. Fligner
Publisher:W. H. Freeman
Introduction to the Practice of Statistics
Statistics
ISBN:9781319013387
Author:David S. Moore, George P. McCabe, Bruce A. Craig
Publisher:W. H. Freeman