
MATLAB: An Introduction with Applications
6th Edition
ISBN: 9781119256830
Author: Amos Gilat
Publisher: John Wiley & Sons Inc
expand_more
expand_more
format_list_bulleted
Related questions
Question
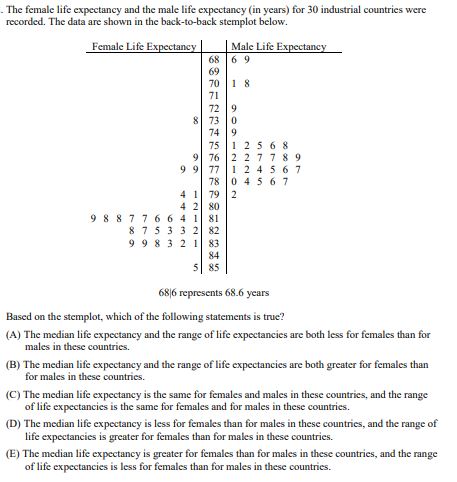

Transcribed Image Text:The female life expectancy and the male life expectancy (in years) for 30 industrial countries were
recorded. The data are shown in the back-to-back stemplot below.
Female Life Expectancy
68
Male Life Expectancy
69
69
70 18
71
72 9.
8 73
0.
9
75
9 76
12 5 68
227789
9 9
77
1 2 4 5 6 7
78
0 4 5 6 7
4 1 79
2
4 2
1 81
80
9 8 8 7 7 6 6 4
8 7 5 3 3 2 821
998 32 183
84
85
686 represents 68.6 years
Based on the stemplot, which of the following statements is true?
(A) The median life expectancy and the range of life expectancies are both less for females than for
males in these countries.
(B) The median life expectancy and the range of life expectancies are both greater for females than
for males in these countries.
(C) The median life expectancy is the same for females and males in these countries, and the range
of life expectancies is the same for females and for males in these countries.
(D) The median life expectancy is less for females than for males in these countries, and the range of
life expectancies is greater for females than for males in these countries.
(E) The median life expectancy is greater for females than for males in these countries, and the range
of life expectancies is less for females than for males in these countries.
Expert Solution
This question has been solved!
Explore an expertly crafted, step-by-step solution for a thorough understanding of key concepts.

This is a popular solution

Trending nowThis is a popular solution!

Step by stepSolved in 5 steps with 2 images

Knowledge Booster

Similar questions
- The table below contains real data for the first two decades of AIDS reporting. Year # AIDS cases diagnosed # AIDS deaths Pre–1981 91 29 1981 319 121 1982 1,170 453 1983 3,076 1,482 1984 6,240 3,466 1985 11,776 6,878 1986 19,032 11,987 1987 28,564 16,162 1988 35,447 20,868 1989 42,674 27,591 1990 48,634 31,335 1991 59,660 36,560 1992 78,530 41,055 1993 78,834 44,730 1994 71,874 49,095 1995 68,505 49,456 1996 59,347 38,510 1997 47,149 20,736 1998 38,393 19,005 1999 25,174 18,454 2000 25,522 17,347 2001 25,643 17,402 2002 26,464 16,371 Total 802,118 489,093 Graph "year" vs. "# AIDS deaths." Do not include pre-1981. Label both axes with words. Scale both axes. Calculate the following. (Round your answers to the nearest whole number. Round the correlation coefficient r to four decimal places.) (a) a = (b) b = (c) r = (d) n =arrow_forwardCholesterol levels: A national health survey measured the serum HDL cholesterol levels in a large number of women. Following is a sample of 35 HDL levels (in milligrams per deciliter) that are based on the results of that survey. The list has been sorted into numerical order. 28 28 28 30 31 34 34 35 38 38 39 39 40 41 41 41 41 42 42 43 43 44 46 47 48 49 52 53 56 61 63 65 68 68 69 Send data to Excel Part 1 of 2 (a) What is the 17th percentile? The 17" percentile is Part 2 of 2 (b) What is the 72nd percentile? The 72nd percentile is. Check Answer Save For Later Submit Assignment ZUZMCorawl LLC. All Rights Reserved. Terms of Use Privacy Centerarrow_forwardSales of RedShoes.com follow a peculiar, but predictable, pattern that determines how many units will sell in any given year. This pattern is shown below. Unit Sales Shoe Color 2007 2008 2009 2010 2011 2012 2013 2014 2015 2016 2017 2018 Red 28 42 21 23 29 15 8 4 2 1 discontinued Green 26 39 20 22 28 14 7 4 2 White 43 65 33 36 45 23 12 Brown 58 87 44 48 60 Yellow 37 56 28 31 Black 28 42 21 Orange 19 29 Purple 24 Total 28 42 21 49 68 78 95 123 176 181 164 179 Questions A) Which color will sell the most units in 2019? B) Which color will sell the most units combined in the 2019 to 2021 period? Please show all your analysis, leave formulas in cells, and specify any assumptions you make.arrow_forward
- A statistics professor would like to build a model relating student scores on the first test to the scores on the second test. The test scores from a random sample of 21 students who have previously taken the course are given in the table. Student Test Grade 1 Test Grade 21 42 812 51 743 88 624 99 575 54 726 66 737 87 638 99 579 97 5810 89 6311 42 7712 71 6313 96 5514 56 7615 75 6916 57 7017 62 7518 89 6319 50 7220 56 7221 89 57Step 1 of 2 : Using statistical software, estimate the parameters of the modelSecond Test Grade=β0+β1(First Test Grade)+εi.Enter a negative estimate as a negative number in the regression model. Round your answers to 4 decimal places, if necessary.arrow_forwardThe 94 students in a statistics class are categorized by gender and by the year in school. The numbers obtained are displayed below in Figure 1. Gender Male Female Total Year in school Freshman Sophomore Junior Senior 2 9 17 17 13 7 19 22 24 1 23 24 Fig. 1: Summary Graduate Total 2 3 5 31 63 94 (a) What proportion of the statistics students in this class is sophomores? (b) What proportion of the statistics students in this class is male? (c) The data are going to be summarized by computing the conditional distribu- tions of year in school for male and female students. What would be the entry (in proportions) for male sophomores?arrow_forwardThe table below contains real data for the first two decades of AIDS reporting. Year # AIDS cases diagnosed # AIDS deaths Pre-1981 91 29 1981 319 121 1982 1,170 453 1983 3,076 1,482 1984 6,240 3,466 1985 11,776 6,878 1986 19,032 11,987 1987 28,564 16,162 1988 35,447 20,868 1989 42,674 27,591 1990 48,634 31,335 1991 59,660 36,560 1992 78,530 41,055 1993 78,834 44,730 1994 71,874 49,095 1995 68,505 49,456 1996 59,347 38,510 1997 47,149 20,736 1998 38,393 19,005 1999 25,174 18,454 2000 25,522 17,347 2001 25,643 17,402 2002 26,464 16,371 Total 802,118 489,093 Graph "year" versus "# AIDS cases diagnosed" (plot the scatter plot). Do not include pre-1981 data. Perform linear regression. Write the equations. (Round your answers to the nearest whole number. Round r to four decimal places.) (a) Linear Equation: 9 - (b) a = (c) b= (d) (e) n-arrow_forward
- The Pew Research Center conducted a survey of randomly sampled American adults, asking them about their use of social networking sites such as Facebook. The table below shows the frequency of users "liking" content on Facebook, with the data shown by gender. Does the frequency of "liking" depend on the gender of the user? Į Liking/Gender Male Female Total Every day 77 142 219 3 – 5 days/week 39 54 93 1 – 2 days/week 62 69 131 Every few weeks 42 44 86 Less often 166 182 348 Total 386 491 877 Table 1 Gender and frequency of "liking" content on Facebook Round your answer for the chi-square statistic to one decimal place, and your answer for the p-value to three decimal places. chi-square statistic = i p-value iarrow_forwardThe following table lists animals that have some of the longest lifespans on earth. Does incubation or gestation time affect an animal’s average lifespan? Some animals have lifespans that average well over 100 years.Animal: Nile, Crocodile, Aldabra Giant Tortoise LakeSturgeon, Galapagos Tortoise, Bowhead Whale Average Lifespan (in Years): 100,152,152,177,211Incubation/Gestation (in Months): 3, 8, 0.25, 4.7,13.5 Is there a correlation between an animal’s gestation/incubation period and its average lifespan in years? a. Draw the scatterplot for the variables. b. Describe the relationship, if any, shown by the scatterplot. c. Calculate r, the correlation coefficient. How does the correlation coefficient compare to the relationship you saw in the scatterplot?arrow_forwardEleven sets of fraternal twins are tracked to see the number of years of education the results are as follows: Sister: 14 16 13 12 19 9 12 14 11 20 16 Brother: 16 17 12 14 19 11 18 17 14 17 16 Is there significant difference in the years of education between a fraternal borother and sister? ( alpha = .10)arrow_forward
- What level of data is "number of offenses"?arrow_forwardThe data contains the trunk circumference and height (in inches) of 31 black cherry trees. Suppose you are interested in predicting the height of a tree from its trunk circumference. Circumference Height 8.3 70 8.6 65 8.8 63 10.5 72 10.7 81 10.8 83 11 66 11 75 11.1 80 11.2 75 11.3 79 11.4 76 11.4 76 11.7 69 12 75 12.9 74 12.9 85 13.3 86 13.7 71 13.8 64 14 78 14.2 80 14.5 74 16 72 16.3 77 17.3 81 17.5 82 17.9 80 18 80 18 80 20.6 87 Is the regression slope significantly different from 0 at the 5% significance level? Report the test statistic, critical value, and p-value. You do not have to perform all steps of the hypothesis test.arrow_forwardSee enclosed image.arrow_forward
arrow_back_ios
SEE MORE QUESTIONS
arrow_forward_ios
Recommended textbooks for you
- MATLAB: An Introduction with ApplicationsStatisticsISBN:9781119256830Author:Amos GilatPublisher:John Wiley & Sons Inc
 Probability and Statistics for Engineering and th...StatisticsISBN:9781305251809Author:Jay L. DevorePublisher:Cengage Learning
 Statistics for The Behavioral Sciences (MindTap C...StatisticsISBN:9781305504912Author:Frederick J Gravetter, Larry B. WallnauPublisher:Cengage Learning
  Elementary Statistics: Picturing the World (7th E...StatisticsISBN:9780134683416Author:Ron Larson, Betsy FarberPublisher:PEARSON
 The Basic Practice of StatisticsStatisticsISBN:9781319042578Author:David S. Moore, William I. Notz, Michael A. FlignerPublisher:W. H. Freeman
 Introduction to the Practice of StatisticsStatisticsISBN:9781319013387Author:David S. Moore, George P. McCabe, Bruce A. CraigPublisher:W. H. Freeman
MATLAB: An Introduction with Applications
Statistics
ISBN:9781119256830
Author:Amos Gilat
Publisher:John Wiley & Sons Inc
Probability and Statistics for Engineering and th...
Statistics
ISBN:9781305251809
Author:Jay L. Devore
Publisher:Cengage Learning
Statistics for The Behavioral Sciences (MindTap C...
Statistics
ISBN:9781305504912
Author:Frederick J Gravetter, Larry B. Wallnau
Publisher:Cengage Learning
Elementary Statistics: Picturing the World (7th E...
Statistics
ISBN:9780134683416
Author:Ron Larson, Betsy Farber
Publisher:PEARSON
The Basic Practice of Statistics
Statistics
ISBN:9781319042578
Author:David S. Moore, William I. Notz, Michael A. Fligner
Publisher:W. H. Freeman
Introduction to the Practice of Statistics
Statistics
ISBN:9781319013387
Author:David S. Moore, George P. McCabe, Bruce A. Craig
Publisher:W. H. Freeman