
MATLAB: An Introduction with Applications
6th Edition
ISBN: 9781119256830
Author: Amos Gilat
Publisher: John Wiley & Sons Inc
expand_more
expand_more
format_list_bulleted
Related questions
Question
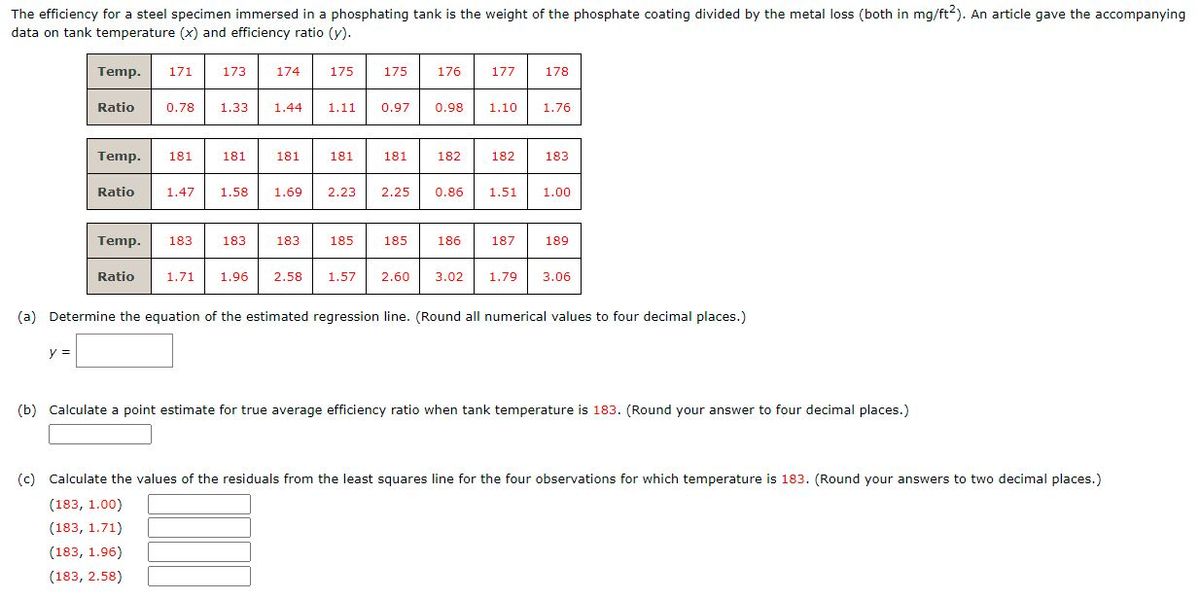

Transcribed Image Text:The efficiency for a steel specimen immersed in a phosphating tank is the weight of the phosphate coating divided by the metal loss (both in mg/ft2). An article gave the accompanying
data on tank temperature (x) and efficiency ratio (y).
Temp.
171
173
174
175
175
176
177
178
Ratio
0.78
1.33
1.44
1.11
0.97
0.98
1.10
1.76
Temp.
181
181
181
181
181
182
182
183
Ratio
1.47
1.58
1.69
2.23
2.25
0.86
1.51
1.00
Temp.
183
183
183
185
185
186
187
189
Ratio
1.71
1.96
2.58
1.57
2.60
3.02
1.79
3.06
(a) Determine the equation of the estimated regression line. (Round all numerical values to four decimal places.)
y =
(b) Calculate a point estimate for true average efficiency ratio when tank temperature is 183. (Round your answer to four decimal places.)
(c) Calculate the values of the residuals from the least squares line for the four observations for which temperature is 183. (Round your answers to two decimal places.)
(183, 1.00)
(183, 1.71)
(183, 1.96)
(183, 2.58)

Transcribed Image Text:Why do they not all have the same sign?
O These residuals do not all have the same sign because in the cases of the first two pairs of observations, the observed efficiency ratios were smaller than the predicted value.
In the cases of the last two pairs of observations, the observed efficiency ratios were larger than the predicted value.
O These residuals do not all have the same sign because in the case of the second pair of observations, the observed efficiency ratio was equal to the predicted value. In the
cases of the other pairs of observations, the observed efficiency ratios were larger than the predicted value.
O These residuals do not all have the same sign because in the cases of the first two pairs of observations, the observed efficiency ratios were larger than the predicted value. In
the cases of the last two pairs of observations, the observed efficiency ratios were smaller than the predicted value.
O These residuals do not all have the same sign because in the case of the third pair of observations, the observed efficiency ratio was equal to the predicted value. In the cases
of the other pairs of observations, the observed efficiency ratios were smaller than the predicted value.
(d) What proportion of the observed variation in efficiency ratio can be attributed to the simple linear regression relationship between the two variables? (Round your answer to three
decimal places.)
Expert Solution
This question has been solved!
Explore an expertly crafted, step-by-step solution for a thorough understanding of key concepts.

This is a popular solution

Trending nowThis is a popular solution!

Step by stepSolved in 3 steps with 3 images

Knowledge Booster


Learn more about
Need a deep-dive on the concept behind this application? Look no further. Learn more about this topic, statistics and related others by exploring similar questions and additional content below.Similar questions
- 3 The mass of a uniform sphere varies directly with the cube of its radius. A certain sphere has radius 3cm and mass 113.1 g. Find the mass of another sphere with radius 5 cm.arrow_forwardWrite a clear answer of your own work, pleasearrow_forwardWater is flowing into a tub for washing clothes. The table shows the rate at which the water flows, in gallons per minute. The tub initially had five gallons of water in it before the faucet was turned on. t, in minutes 0 0.5 1 1.5 2 2.5 3 3.5 Flow rate, in 0.5 1 1.2 1.4 1.7 2 gal/min 2.1 3 Use the information in this problem to determine the amount of water in the tub after the first 3 minutes have passed. a) Calculate the amount of water in the tub using left approximating rectangles. b) Calculate the amount of water in the tub using right approximating rectangles. c) Use the two answers above to determine the most accurate answer you can.arrow_forward
arrow_back_ios
arrow_forward_ios
Recommended textbooks for you
- MATLAB: An Introduction with ApplicationsStatisticsISBN:9781119256830Author:Amos GilatPublisher:John Wiley & Sons Inc
 Probability and Statistics for Engineering and th...StatisticsISBN:9781305251809Author:Jay L. DevorePublisher:Cengage Learning
 Statistics for The Behavioral Sciences (MindTap C...StatisticsISBN:9781305504912Author:Frederick J Gravetter, Larry B. WallnauPublisher:Cengage Learning
  Elementary Statistics: Picturing the World (7th E...StatisticsISBN:9780134683416Author:Ron Larson, Betsy FarberPublisher:PEARSON
 The Basic Practice of StatisticsStatisticsISBN:9781319042578Author:David S. Moore, William I. Notz, Michael A. FlignerPublisher:W. H. Freeman
 Introduction to the Practice of StatisticsStatisticsISBN:9781319013387Author:David S. Moore, George P. McCabe, Bruce A. CraigPublisher:W. H. Freeman
MATLAB: An Introduction with Applications
Statistics
ISBN:9781119256830
Author:Amos Gilat
Publisher:John Wiley & Sons Inc
Probability and Statistics for Engineering and th...
Statistics
ISBN:9781305251809
Author:Jay L. Devore
Publisher:Cengage Learning
Statistics for The Behavioral Sciences (MindTap C...
Statistics
ISBN:9781305504912
Author:Frederick J Gravetter, Larry B. Wallnau
Publisher:Cengage Learning
Elementary Statistics: Picturing the World (7th E...
Statistics
ISBN:9780134683416
Author:Ron Larson, Betsy Farber
Publisher:PEARSON
The Basic Practice of Statistics
Statistics
ISBN:9781319042578
Author:David S. Moore, William I. Notz, Michael A. Fligner
Publisher:W. H. Freeman
Introduction to the Practice of Statistics
Statistics
ISBN:9781319013387
Author:David S. Moore, George P. McCabe, Bruce A. Craig
Publisher:W. H. Freeman