MATLAB: An Introduction with Applications
6th Edition
ISBN: 9781119256830
Author: Amos Gilat
Publisher: John Wiley & Sons Inc
expand_more
expand_more
format_list_bulleted
Question

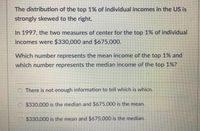
Transcribed Image Text:The distribution of the top 1% of individual incomes in the US is
strongly skewed to the right.
In 1997, the two measures of center for the top 1% of individual
incomes were $330,000 and $675,000.
Which number represents the mean income of the top 1% and
which number represents the median income of the top 1%?
There is not enough information to tell which is whicn.
$330,000 is the median and $675.000 is the mean.
$330,000 is the mean and $675,000 is the median.
Expert Solution
This question has been solved!
Explore an expertly crafted, step-by-step solution for a thorough understanding of key concepts.
This is a popular solution
Trending nowThis is a popular solution!
Step by stepSolved in 2 steps

Knowledge Booster
Similar questions
- Below are actual statistics from the 2020-2021 Miami Heat Basketball players. It demonstrates the number of points scored per game for each player on the team during the regular season (in other words the number of points they scored all season, divided by the total number of games they played). Is the mode a good way to represent the number of points scored per game for all the players on the heat? why or why not? Why is the mean different from the mode and median? What do you think might be the cause of this difference?arrow_forwardWhich statistic would you use if you are interested in comparing the mean number of hours worked by sex.arrow_forwardshould have the right to marry. (The 2014 data were collected before the 2015 U.S. C2. GSS 2014 and GSS 2018 respondents were asked their opinion on whether homosexuals 30 measured on a 5-point scale from strongly agree (1) to strongly disagree (5). Supreme Court decision granting same-sex couples the right to marry. Responses wer measured on a 5-point scale from strongly agree (1) to strong!y aisagiee (2). Cumulative Percentage Homosexuals Should Have Right to Marry (2014) Percentage Frequency 32.5 32.5 Strongly agree 251 57.5 25.2 Agree 195 67.3 Neither agree nor disagree 9.6 74 79.2 Disagree 92 11.9 100.0 Strongly disagree 161 20.8 Total 773 100.0 Homosexuals Should Have Cumulative Right to Marry (2018) Frequency Percentage Percentage Strongly agree 293 39.5 39.5 Agree 200 27.0 66.5 Neither agree nor disagree 70 9.4 75.9 Disagree 67 9.0 84.9 Strongly disagree 111 15.0 99.9 Total 741 99.9 a. What is the level of measurement for this variable? b. What is the mode for 2014? For 2018?arrow_forward
- The average salary of male employees in a firm was $520 and that of females was $420. The mean salary of all the employees was 500. Find the percentage of male and female employees.arrow_forwardwhat is the mean, median and mode of 0 5 10 15 20 25 ?arrow_forwardIf the mean of a data set is 22 and the SD is 5, what % of the values fall between 12 and 27? Give a 2-decimalarrow_forward
- What is ranked data?arrow_forwardJoselyn hopes to receive a grade of B or better in her statistics class. Currently she has scored 75, 83, and 81 on her three in-class tests and also has a homework average of 88. Her professor calculates the class grade by finding the mean of five grades: three in-class tests, the homework average and the final exam. What is the minimum score Joselyn must earn on the final exam to have a class grade (mean) of 80? A. 67 B. 95 C. 70 D. 73arrow_forwardAt a school several teachers were holding a contest to see which class could earn the most trivia points. Mrs.William's class scored 61 points. Mr. Adams class earned 48 points. Mrs. Brown's class earned 50 and Mrs.Daniel's class earned 50. Determine the mean, median, mode and range of the number of points scored.arrow_forward
- find an example of when statistics were misused/skewed and state the reason why you think the statistics were reported that way.arrow_forwardDoes the mean represent the center of the data?arrow_forwardThe highest score in a distribution is 74 and the lowest score is 51. What is the range?arrow_forward
arrow_back_ios
SEE MORE QUESTIONS
arrow_forward_ios
Recommended textbooks for you
 MATLAB: An Introduction with ApplicationsStatisticsISBN:9781119256830Author:Amos GilatPublisher:John Wiley & Sons Inc
 Probability and Statistics for Engineering and th...StatisticsISBN:9781305251809Author:Jay L. DevorePublisher:Cengage Learning
 Statistics for The Behavioral Sciences (MindTap C...StatisticsISBN:9781305504912Author:Frederick J Gravetter, Larry B. WallnauPublisher:Cengage Learning
 Elementary Statistics: Picturing the World (7th E...StatisticsISBN:9780134683416Author:Ron Larson, Betsy FarberPublisher:PEARSON
 The Basic Practice of StatisticsStatisticsISBN:9781319042578Author:David S. Moore, William I. Notz, Michael A. FlignerPublisher:W. H. Freeman
 Introduction to the Practice of StatisticsStatisticsISBN:9781319013387Author:David S. Moore, George P. McCabe, Bruce A. CraigPublisher:W. H. Freeman

MATLAB: An Introduction with Applications
Statistics
ISBN:9781119256830
Author:Amos Gilat
Publisher:John Wiley & Sons Inc

Probability and Statistics for Engineering and th...
Statistics
ISBN:9781305251809
Author:Jay L. Devore
Publisher:Cengage Learning

Statistics for The Behavioral Sciences (MindTap C...
Statistics
ISBN:9781305504912
Author:Frederick J Gravetter, Larry B. Wallnau
Publisher:Cengage Learning

Elementary Statistics: Picturing the World (7th E...
Statistics
ISBN:9780134683416
Author:Ron Larson, Betsy Farber
Publisher:PEARSON

The Basic Practice of Statistics
Statistics
ISBN:9781319042578
Author:David S. Moore, William I. Notz, Michael A. Fligner
Publisher:W. H. Freeman

Introduction to the Practice of Statistics
Statistics
ISBN:9781319013387
Author:David S. Moore, George P. McCabe, Bruce A. Craig
Publisher:W. H. Freeman