
MATLAB: An Introduction with Applications
6th Edition
ISBN: 9781119256830
Author: Amos Gilat
Publisher: John Wiley & Sons Inc
expand_more
expand_more
format_list_bulleted
Related questions
Question
(b) Find the value of the chi-square statistic for the sample. (Round the expected frequencies to three decimal places. Round the test statistic to three decimal places.)
What are the degrees of freedom?
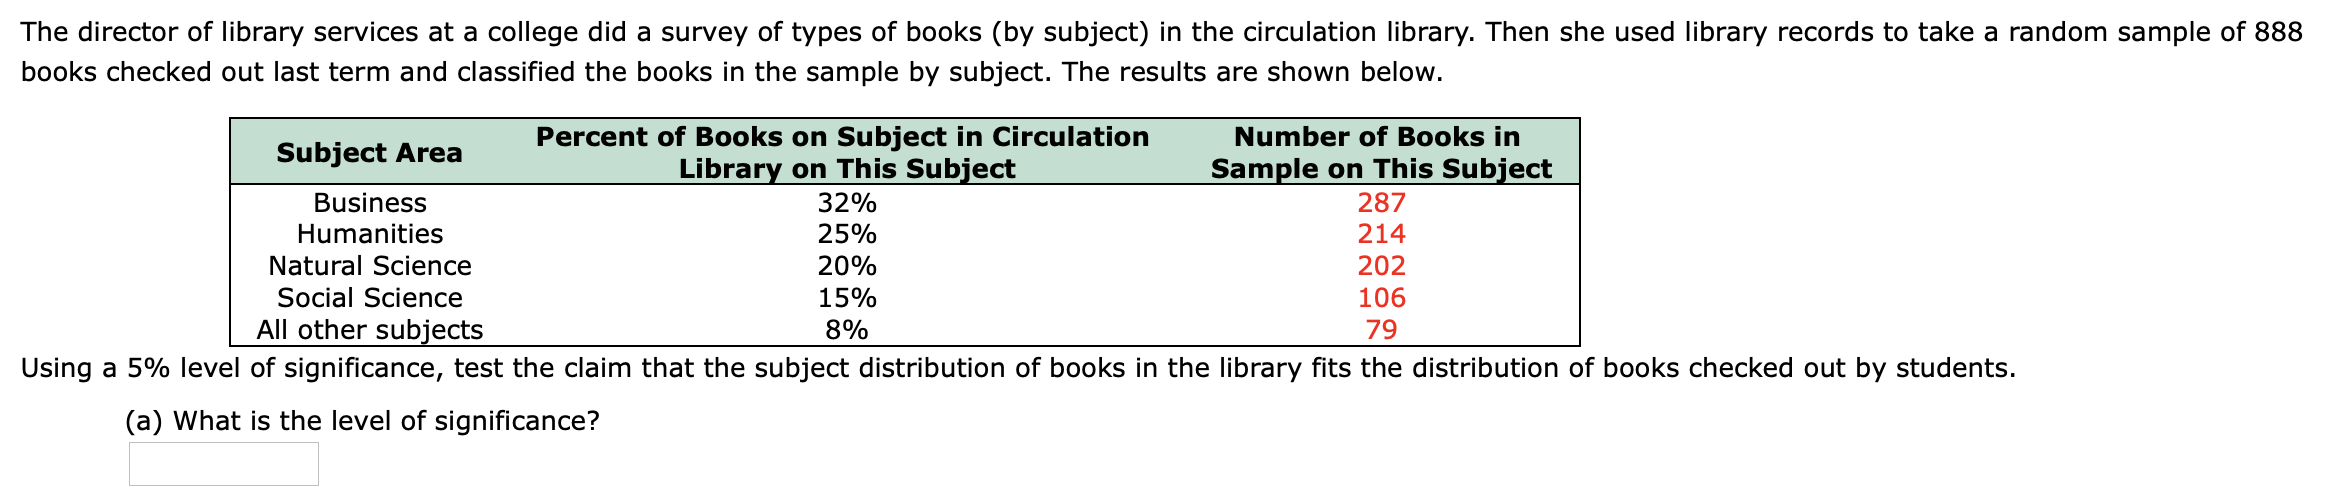

Transcribed Image Text:The director of library services at a college did a survey of types of books (by subject) in the arculation library. Then she used library records to take a random sample of 888
books checked out last term and classifled the books in the sample by subject. The results are shown below.
Percent of Books on Subject in Circulation
Library on This Subject
32%
25%
Number of Books in
Subject Area
Business
Humanities
Natural Science
Sample on This Subject
287
214
202
106
79
20%
Social Science
All other subjects
15%
8%
Using a 5% level of significance, test the claim that the subject distribution of books in the library fits the distribution of books checked out by students.
(a) What is the level of significance?
Expert Solution
This question has been solved!
Explore an expertly crafted, step-by-step solution for a thorough understanding of key concepts.

Step by stepSolved in 4 steps with 13 images

Knowledge Booster


Learn more about
Need a deep-dive on the concept behind this application? Look no further. Learn more about this topic, statistics and related others by exploring similar questions and additional content below.Similar questions
- Anyone who has been outdoors on a summer evening has probably heard crickets. Did you know that it is possible to use the cricket as a thermometer? Crickets tend to chirp more frequently as temperatures increase. This phenomenon was studied in detail by George W. Pierce, a physics professor at Harvard. In the following data, x is a random variable representing chirps per second and y is a random variable representing temperature (°F). x 19.8 15.3 20.4 18.1 16.2 15.5 14.7 17.1 y 89.4 73.2 95.3 86.1 78.8 75.2 69.7 82.0 x 15.4 16.2 15.0 17.2 16.0 17.0 14.4 y 69.4 83.3 79.6 82.6 80.6 83.5 76.3 (b) Verify the given sums Σx, Σy, Σx2, Σy2, Σxy, and the value of the sample correlation coefficient r. (Round your value for r to three decimal places.) Σx = Σy = Σx2 = Σy2 = Σxy = r = (c) Find x, and y. Then find the equation of the least-squares line = a + bx. (Round your answers for x and y to two decimal places. Round your answers for a and…arrow_forwardYou intend to conduct a goodness-of-fit test for a multinomial distribution with 5 categories. You collect data from 71 subjects. What are the degrees of freedom for the x² distribution for this test? d.f. = 85arrow_forwardAnyone who has been outdoors on a summer evening has probably heard crickets. Did you know that it is possible to use the cricket as a thermometer? Crickets tend to chirp more frequently as temperatures increase. This phenomenon was studied in detail by George W. Pierce, a physics professor at Harvard. In the following data, x is a random variable representing chirps per second and y is a random variable representing temperature (°F). 21.0 15.1 19.0 17.6 17.5 15.5 14.7 17.1 y 87.8 71.4 94.1 84.7 81.4 75.2 69.7 82.0 15.4 16.2 15.0 17.2 16.0 17.0 14.4 69.4 83.3 79.6 82.6 80.6 83.5 76.3 Find x, and y. Then find the equation of the least-squares line ŷ = a + bx. (Round your answer to four decimal places.) %3D X = y = + %3D Find the value of the coefficient of determination r. What percentage of the variation in y can be explained by the corresponding variation in x and the least-squares line? What percentage is unexplained? (Round your answer for r² to four decimal places. Round your…arrow_forward
- Refer to the table of sample values in Section 8.2 Exercise 10 of the text.Find the values of the UCL and LCL for the (x-bar) chart for this data, and round your answers to 3 places after the decimal point.arrow_forwardRefer to the table of sample values in Section 8.2 Exercise 6 of the text.Find the values of the UCL and LCL for the R chart for this data, and round your answers to 3 places after the decimal point.arrow_forwardYou are doing research on balance and fitness. To complete this research you will need a watch with a second hand. Identify a random sample of n = 12 men and n = 8 women. You must answer this question: How do you establish that this sample is truly random? Have each subject perform the following task: Have the subjects stand with their hands at their side, raise one knee, cross their ankle over the other knee, squat and bring their hands palms together in front of their chest. Time the subject until they put their foot back down on the floor. b) Ask the following questions: i) How many days per week do they exercise? ii) What is their favorite exercise? You will analyze your data and compute the following statistics for each group: 1) The Mean and standard deviation of the number of seconds the subject stayed balanced 2) The Median number of days per week exercised 3) The Mode of the favorite exercise 4) The 90% confidence interval of the mean Construct a complete…arrow_forward
- Is the difference between the mean annual salaries of statisticians in Region 1 and Region 2 more than $5000? To decide, you select a random sample of statisticians from each region. The results of each survey are shown to the right. At a = 0.10, what should you conclude? Region 1 X1 = $67,700 Region 2 X2 = $62,000 01 = $8825 02 = $9025 n1 = 48 n2 = 43 Click here to view page 1 of the standard normal distribution table. Click here to view page 2 of the standard normal distribution table. ..... Choose the correct null and alternative hypotheses below. B. Ho: H1- H2 O C. Ho: H1 -H2 > 5000 Ha: H1 - H2 55000 O A. Ho: H1 - H2 > 5000 + 5000 Ha: H1 - H2 2 5000 Ha: H1 - H2 = 5000 O E. Ho: H1 - H2 2 5000 O D. Ho: H1 - H2 = 5000 Ha: H1 - H2 # 5000 F. Ho: µ1 - H2 5 5000 Ha: H1 - H2 > 5000 Ha: H1 - H2 В. Zarrow_forwardWhat is the Sample?arrow_forwardIs the difference between the mean annual salaries of statisticians in Region 1 and Region 2 more than $4000? To decide, you select a random sample of statisticians from each region. The results of each survey are shown to the right. At a = 0.10, what should you conclude? Region 1 X1 = $67,700 01 = $8875 Region 2 X2 = $61,000 02 = $9250 n1 = 48 n2 = 44 Click here to view page 1 of the standard normal distribution table. Click here to view page 2 of the standard normal distribution table. Choose the correct answer below. O A. Reject Ho. At the 10% significance level, there is sufficient evidence to support the claim that the difference between the mean annual salaries is more than $4000. O B. Fail to reject Ho. At the 10% significance level, there is sufficient evidence to support the claim that the difference between the mean annual salaries is more than $4000. OC. Reject Ho. At the 10% significance level, there is insufficient evidence to support the claim that the difference between…arrow_forward
arrow_back_ios
arrow_forward_ios
Recommended textbooks for you
- MATLAB: An Introduction with ApplicationsStatisticsISBN:9781119256830Author:Amos GilatPublisher:John Wiley & Sons Inc
 Probability and Statistics for Engineering and th...StatisticsISBN:9781305251809Author:Jay L. DevorePublisher:Cengage Learning
 Statistics for The Behavioral Sciences (MindTap C...StatisticsISBN:9781305504912Author:Frederick J Gravetter, Larry B. WallnauPublisher:Cengage Learning
  Elementary Statistics: Picturing the World (7th E...StatisticsISBN:9780134683416Author:Ron Larson, Betsy FarberPublisher:PEARSON
 The Basic Practice of StatisticsStatisticsISBN:9781319042578Author:David S. Moore, William I. Notz, Michael A. FlignerPublisher:W. H. Freeman
 Introduction to the Practice of StatisticsStatisticsISBN:9781319013387Author:David S. Moore, George P. McCabe, Bruce A. CraigPublisher:W. H. Freeman
MATLAB: An Introduction with Applications
Statistics
ISBN:9781119256830
Author:Amos Gilat
Publisher:John Wiley & Sons Inc
Probability and Statistics for Engineering and th...
Statistics
ISBN:9781305251809
Author:Jay L. Devore
Publisher:Cengage Learning
Statistics for The Behavioral Sciences (MindTap C...
Statistics
ISBN:9781305504912
Author:Frederick J Gravetter, Larry B. Wallnau
Publisher:Cengage Learning
Elementary Statistics: Picturing the World (7th E...
Statistics
ISBN:9780134683416
Author:Ron Larson, Betsy Farber
Publisher:PEARSON
The Basic Practice of Statistics
Statistics
ISBN:9781319042578
Author:David S. Moore, William I. Notz, Michael A. Fligner
Publisher:W. H. Freeman
Introduction to the Practice of Statistics
Statistics
ISBN:9781319013387
Author:David S. Moore, George P. McCabe, Bruce A. Craig
Publisher:W. H. Freeman