
MATLAB: An Introduction with Applications
6th Edition
ISBN: 9781119256830
Author: Amos Gilat
Publisher: John Wiley & Sons Inc
expand_more
expand_more
format_list_bulleted
Related questions
Concept explainers
Question
8) see pictures to solve

Transcribed Image Text:B
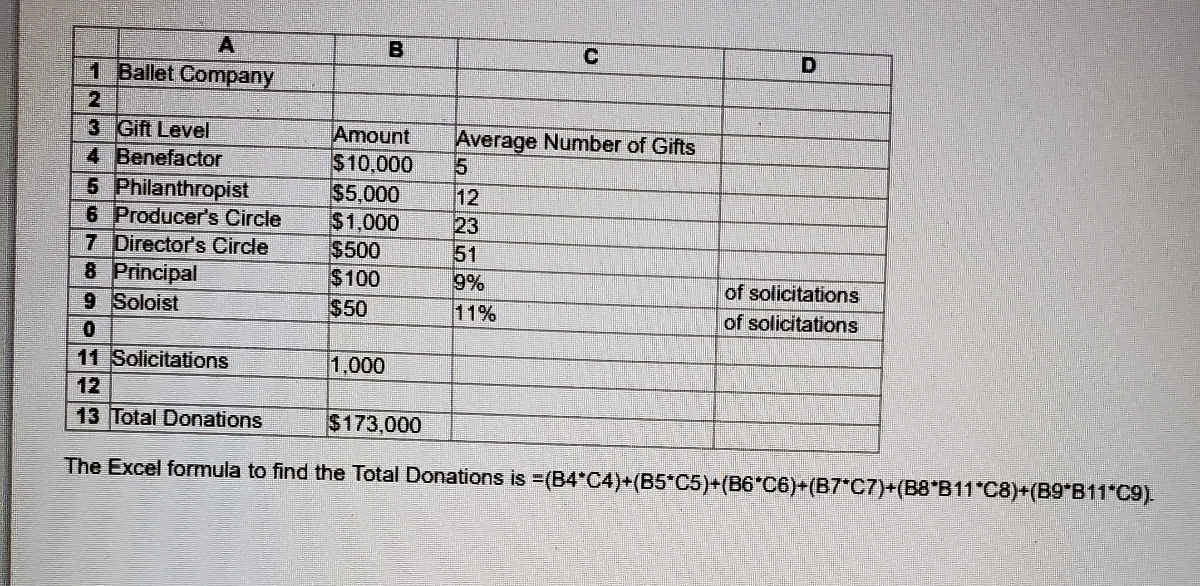
1 Ballet Company
3 Gift Level
4 Benefactor
Amount
$10,000
$5,000
$1,000
$500
$100
$50
Average Number of Gifts
5.
5 Philanthropist
6 Producer's Circle
7 Director's Circle
8 Principal
9 Soloist
12
23
51
9%
11%
of solicitations
of solicitations
11 Solicitations
1,000
12
13 Total Donations
$173,000
The Excel formula to find the Total Donations is =(B4 C4)+(B5*C5)+(B6*C6)+(B7*C7)+(B8"B11*"C8)+(B9*B11"C9).

Transcribed Image Text:The director of a nonprofit ballet company is planning its next fundraising campaign. In recent years, the program has faund the given percentages of donors and gift levels. These were used to develop a spreadsheet model to calculate the total amount donated.
Use a one-way data table to show how the amount varies based on the number of solicitations.
E Click the icon to view the ballet company fundraising model.
Fill in the missing values from the one-way data table to show how the amount varies based on the number of solicitations
(Simplify your answers. Type integers or decimals. Do not round.)
Total
Donations
Solicitations
500
600
700
800
2$
900
1000
1100
1200
1300
1400
1500
1600
Expert Solution
This question has been solved!
Explore an expertly crafted, step-by-step solution for a thorough understanding of key concepts.

This is a popular solution

Trending nowThis is a popular solution!

Step by stepSolved in 2 steps

Knowledge Booster


Learn more about
Need a deep-dive on the concept behind this application? Look no further. Learn more about this topic, statistics and related others by exploring similar questions and additional content below.Similar questions
Recommended textbooks for you
- MATLAB: An Introduction with ApplicationsStatisticsISBN:9781119256830Author:Amos GilatPublisher:John Wiley & Sons Inc
 Probability and Statistics for Engineering and th...StatisticsISBN:9781305251809Author:Jay L. DevorePublisher:Cengage Learning
 Statistics for The Behavioral Sciences (MindTap C...StatisticsISBN:9781305504912Author:Frederick J Gravetter, Larry B. WallnauPublisher:Cengage Learning
  Elementary Statistics: Picturing the World (7th E...StatisticsISBN:9780134683416Author:Ron Larson, Betsy FarberPublisher:PEARSON
 The Basic Practice of StatisticsStatisticsISBN:9781319042578Author:David S. Moore, William I. Notz, Michael A. FlignerPublisher:W. H. Freeman
 Introduction to the Practice of StatisticsStatisticsISBN:9781319013387Author:David S. Moore, George P. McCabe, Bruce A. CraigPublisher:W. H. Freeman
MATLAB: An Introduction with Applications
Statistics
ISBN:9781119256830
Author:Amos Gilat
Publisher:John Wiley & Sons Inc
Probability and Statistics for Engineering and th...
Statistics
ISBN:9781305251809
Author:Jay L. Devore
Publisher:Cengage Learning
Statistics for The Behavioral Sciences (MindTap C...
Statistics
ISBN:9781305504912
Author:Frederick J Gravetter, Larry B. Wallnau
Publisher:Cengage Learning
Elementary Statistics: Picturing the World (7th E...
Statistics
ISBN:9780134683416
Author:Ron Larson, Betsy Farber
Publisher:PEARSON
The Basic Practice of Statistics
Statistics
ISBN:9781319042578
Author:David S. Moore, William I. Notz, Michael A. Fligner
Publisher:W. H. Freeman
Introduction to the Practice of Statistics
Statistics
ISBN:9781319013387
Author:David S. Moore, George P. McCabe, Bruce A. Craig
Publisher:W. H. Freeman