The defect test results of the regression model are reported as follows: Modified Wald test for groupwise heteroskedasticity in fixed effect regression model HO: sigma (i)^2 = sigma^2 for all i chi2 (2094) = 2.1e+05 Prob>chi2 = 0.0000 What defects does the model have? How to fix it?
Q: Consider the given discrete probability distribution. X 1 2 3 4 5 P(X) 0.3 0.1 0.2 0.3 0.1 Calculate…
A: Answer: From the given data, Given discrete probability distribution, X : 1…
Q: What is the sample size? What is the sample mean? Calculate the sample variance. What is the…
A: What is the sample size n=50
Q: Test the claim that the proportion of men who own cats is smaller than 20% at the .10 significance l
A: claim : proportion of men who own cats is smaller than 20% significance level = .10
Q: Fourty percent of the students in a class of 100 are planning to go to graduate school, Find the…
A: Answer: From the given data, Sample size(n) = 100 Probability of students planning to go to graduate…
Q: hat is a regression analysis and how is it used in statistics?
A: Regression analysis is a technique that is used to establish a relationship between two or more…
Q: A binomial probability experiment is conducted with the given parameters. Compute the probability of…
A: Answer:- Given, Sample size, n = 10 Probability of success on a trial, p = 0.5 Number of success,…
Q: Use the normal distribution to the right to answer the questions. (a) What percent of the scores are…
A: Normal distribution curve is Mean(μ)=19.5standard deviation(σ)=5.5
Q: This is exactly what I got but the answer in the system says it is incorrect.
A: The sample size is 64, sample mean is 44500 and the sample standard deviation is 6800.
Q: A university reports that 60% of its students enroll there as freshmen, while the rest transfer in…
A: It is required to find the probability that a former student who graduated from the university was a…
Q: EXPONENTIAL REGRESSION: 1) With the following data apply the exponential regression (IMG 1) A.…
A: To apply exponential regression and answer the questions, follow these steps in R: Step 1: Create a…
Q: A weight-loss clinic advertised that last month its patients, on average, lost 6 lb. Assuming that…
A: It is required to choose the correct statement(s).
Q: We tested to see if women were more likely to do aerobics than men at the α = 0.02 level, and found…
A: It is needed to test whether women were more likely to do aerobics than men.
Q: Many people believe that the average number of Facebook friends is 125. The population standard…
A: Answer Given Sample size [n] = 49 Standard deviation [s] =36.8 Sample mean [x] =146 level of…
Q: Test the claim at the given significance level.
A: A poll of 1068 adult Americans reveals that 48% of the voters surveyed prefer the Democratic…
Q: Researchers conducting a study of 15 children with a diagnosis of ADHD wish to assess whether the…
A: Median: It represents the middle value for any given data set. There are two cases arises. Case…
Q: If X is a random variable with expectation µ and variance cµ2 , where c is a constant. Find a…
A: X= random variable expectation µ and variance cμ2 where c is constant then we need to find the…
Q: A statistical program is recommended. A company that sells musical instruments has been in business…
A: Denote the time series or sales value for a particular quarter corresponding to time point t, as yt,…
Q: A1 A Page 142 X ✓ fx B Problem #4-10 (1000s) YouTube Guitar Views Sales 30 40 70 60 80 50 8H2O53 11…
A: X Y 30 8 40 11 70 12 60 10 80 15 50 13
Q: The linear regression equation for predicting systolic blood pressure from age is as follows: y = 54…
A: The regression equation is used for the prediction of a dependent variable based on the independent…
Q: Complete parts (a) through (h) for the data below. 4 5 8 9 6 8 14 16 X y (a) By hand, draw a scatter…
A: The scatter plot can be plotted using the following code in R: This gives the following plot as an…
Q: Suppose a polling agency reported that 45.0% of registered voters were in favor of raising income…
A: Obtain the 90% confidence interval for the proportion of registered voters who are in favor of…
Q: For testing Ho:μ1 = μ2 against H₁:12 at 5% level of significance using two samples, the value of the…
A: The null and alternative hypothesis isH0:μ1=μ2 againstH1:μ1≠μ2significance level(α)=0.05The value…
Q: What will be observed if calculated the three confidence intervals at 90%, 95%, and 99%? How would…
A: if three confidence intervals are calculated at 90% 95% 99%
Q: A company manufactures quartz watches. The watches have an average life of 44.3 months. The standard…
A: A company manufactures quartz watches. The watches have an average life of 44.3 months. The…
Q: Suppose that at a college, 55% of the students earn a degree at the end of four years and 27% earn a…
A: It is given that, at a college 55% of the students earn a degree at the end of four years.
Q: Determine the sample size needed to construct a 95 % confidence interval to estimate the population…
A: Given data P= 0.34 E= 0.06
Q: Is there sufficient evidence to conclude that there is a linear relationship between cardiovascular…
A: Data on 10 randomly selected athletes was obtained concerning their cardiovascular fitness (measured…
Q: Test the following claims. This process should include each step outlined in the text: From a…
A: The question is about hypo. testing Given : Randomly selected no. of bod temp. ( n ) = 26 Sample…
Q: A food safety guideline is that the mercury in fish should be below 1 part per million (ppm).…
A: The question is about confidence interval Given : Mercury in fish should be less than 1 ppm…
Q: The accompanying ANOVA table and information are the result of a randomized block ANOVA test.…
A: Anova table :
Q: Find the conditional probability of the indicated event when two fair dice (one red and one green)…
A: The event is two fair dice rolled. One dice is red colored and another is green colored. The event R…
Q: Suppose that X = {4,8,12,16} and that X 1 ={4,8} X 2 ={4,12} X 3 ={4,16} X 4 ={8,12} X 5 ={8,16} X…
A: Solution-: Given data: xi:4,8,12,16 X1=4,8;X2=4,12;X3=4,16;X4=8,12;X5=8,16;X6=12,16 We want to find…
Q: The table shows the distribution, by age and gender, of the 28.5 million people in a certain region…
A:
Q: I 1.42 4.22 12.28 9.16 28.62 7.92 24.82 9.59 29.82 y 4.11 Find estimates for the linear model yi =…
A: The regression line is used to make predictions. It has two types of variables and two types of…
Q: A random sample of 81 ninth grade student's scores on a national mathematics assessment test has a…
A: Answer: From the given data, Sample size (n) = 81 Sample mean x¯ = 272 Population standard deviation…
Q: The likelihood that a light bulb is defective is 6%, on a particular production line. Eight light…
A: Answer: From the given data, Let X: Defective light bulb P(Defective) = P = 6% = 0.06 Sample size…
Q: The Consumer Reports National Research Center conducted a telephone survey of 2000 adults to learn…
A: using formula for 90% confidence interval
Q: If we want to compare if more women smoke than men, which test should we use? Single sample z-test…
A: If we want to compare if more women smoke than men, which test should we use? Single sample z-test…
Q: Two horses A and B were tested according to the time (in seconds) to run a particular track with the…
A: To test whether the two horses A and B have the same running capacity, we can use a two-sample…
Q: I claim that the mean weight of a certain model of wooden pencil is less than the manufactures claim…
A: The hypothesized (or claimed) mean weight (in ounces) is given as, μ0=0.8. For the sample of 40…
Q: A confidence interval for a population mean has length 24. a) Determine the margin of error.…
A: Answer: From the given data, confidence interval for a Population mean has length =24
Q: A study was conducted to determine the proportion of people who dream in black and white instead of…
A: Let x1=number of people over the age of 55 dream in blank and white n1=297, x1=80 x2=number of…
Q: A marketing specialist wants to estimate the average amount spent by visitors to an online…
A: In the field of marketing, it is crucial to understand the behavior of customers to design effective…
Q: The heights of adult men in America are normally distributed, with a mean of 69.1 inches and a…
A: For men: Mean(µ) = 69.1 Standard deviations (σ) = 2.61 For Women: Mean(µ) = 64.4Standard…
Q: We tested to see if the true percentage of caffeine drinkers who smoke is greater than than…
A: It is needed to test whether the true percentage of caffeine drinkers who smoke is greater than…
Q: A recent survey of 1040 U.S. adults selected at random showed that 634 consider the occupation of…
A: 1040 U.S. adults selected at random were surveyed. Among them 634 considered the occupation of…
Q: A company that sells musical instruments has been in business for five years. During that time,…
A: Year Quarter 1 Quarter 2 Quarter 3 Quarter 4 Total Yearly sales 1 5 2 1 5 13 2 7 4 4 14 29 3…
Q: The Customer Service Center in a large New York department store has determined that the amount of…
A: Answer: From the given data, mean (μ) = 16.6 Standard deviation(σ) = 4.04 X ~ Normal…
Q: The raw data gathered on a university campus from a survey of art degree majors and their residency…
A: All the outcomes of an experiment are known as events. The likelihood of an event happening is known…
Q: An article reported that, in a study of a particular wafer inspection process, 348 dies were…
A: Answer: From the given data, Sample size(n) = 348 X = 236 90% confidence interval,
Please help me with the question in the image, if possible, can you explain your answer in detail so that i can understand. Thank you so much in advanced!!!
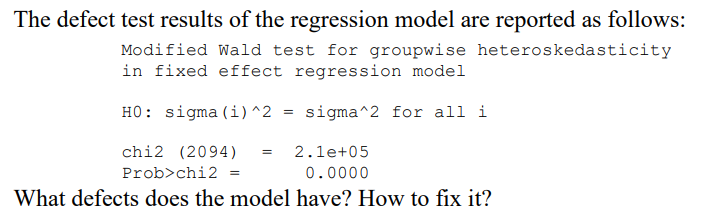
Trending now
This is a popular solution!
Step by step
Solved in 4 steps
- Olympic Pole Vault The graph in Figure 7 indicates that in recent years the winning Olympic men’s pole vault height has fallen below the value predicted by the regression line in Example 2. This might have occurred because when the pole vault was a new event there was much room for improvement in vaulters’ performances, whereas now even the best training can produce only incremental advances. Let’s see whether concentrating on more recent results gives a better predictor of future records. (a) Use the data in Table 2 (page 176) to complete the table of winning pole vault heights shown in the margin. (Note that we are using x=0 to correspond to the year 1972, where this restricted data set begins.) (b) Find the regression line for the data in part ‚(a). (c) Plot the data and the regression line on the same axes. Does the regression line seem to provide a good model for the data? (d) What does the regression line predict as the winning pole vault height for the 2012 Olympics? Compare this predicted value to the actual 2012 winning height of 5.97 m, as described on page 177. Has this new regression line provided a better prediction than the line in Example 2?The number of pounds of steam used per month by a chemical plant is thought to be related to the average ambient temperature (in F) for that month. The past year’s usage and temperatures are in the following table: Assuming that a simple linear regression model is appropriate, fit the regression model relating stem usage (y) to the average temperature (x). What is the estimate of Sigma2? What is the estimate of expected stem usage when the average temperature is 55 F? What change in mean stem usage is expected when the monthly average temperature changes by 1 F? Suppose that the monthly average temperature is 47 F. Calculate the fitted value of y and the corresponding residual. Test for significance of regression using α=0.01 (Use ANOVA). Calculate the r2 of the model. Find a 99% CI for B1 .The following result perspective in RapidMiner shows a multiple linear regression model. Based on the diagram, the model for our dependent variable Y is Predicted Y= (Insulation *0.420)+(Temperature *0.071)+(Avg_Age*0.065)+(Home_Size *0.311)+7.589 Attribute Insulation Temperature Avg Age Home Size (Intercept) O True O False Coefficient 3.323 -0.869 1.968 3.173 134.511 Std. Error 0.420 0.071 0.065 0.311 7.589 Std. Coefficient 0.164 -0.262 0.527 0.131 ? Tolerance 0.431 0.405 0.491 0.914 ? t-Stat 7.906 -12.222 30.217 10.210 17.725
- The least-squares regression equation is y=784.6x+12,431 where y is the median income and x is the percentage of 25 years and older with at least a bachelor's degree in the region. The scatter diagram indicates a linear relation between the two variables with a correlation coefficient of 0.7962. Predict the median income of a region in which 25% of adults 25 years and older have at least a bachelor's degree.One is interested in the ceteris paribus relationship between the dependent variable y, and the explanatory variable ₁1. For this, one collects data on two control variables Xi2 and Xiz and runs two LS regressions. Regression 1: yi = B₁x₁1 + Ui Regression 2: y = B₁xil+ B₂x₁2 + B3x13 + Ei Let ₁ denote the LS estimate of ₁ of Regression 1 and let ₁ denote the LS estimate of ₁ in Regression 2. Assume that the true model is given by Regression 2 and that all variables are centered. a) Would you expect a difference between ₁ and ₁ when is highly correlated with 2 and 3 and the partial effects of xi2 and xi3 on yi are also high? b) Would you expect a difference between ₁ and 3₁ when ₁ has almost no correlation with and Xi3 but X2 and 3 are highly correlated? Xi2 c) Which of the two estimators is more efficient if x₁1 is highly correlated with 2 and 13, and Xiz have small partial effects on yi? but i2 d) Which of the two estimators is more efficient if x₁1 is almost uncorrelated with 2 and…Define the ADL and GLS Estimators of Regression.
- A study was conducted to see if a person's income will affect their well-being. We want to create a model with Y = well-being index, and X = income in $1,000. The regression model is: y = beta0 + beta1*x %D y = beta0 + beta1*x + error %3D y_hat = beta0_hat + beta1_hat*x + error O y_hat = beta0_hat + beta1_hat*xInterpreting technology: The following display from the TI-84 Plus calculator presents the least-squares regression line for predicting the price of a certain stock y from the prime interest rate in percent x LinReg y=+abx a=2.29525776 b=0.38970413 r^2=0.4319044662 r=0.65719439 Regression line equation: 2.295225776+.38970413x What is the correlation between the interest rate and the yield of the stock?Compare the simple linear model in Question 2 and the exponential model in Question 3, do you observe any improvements after conducting the exponential model relative to the linear model? Support your conclusion with details (such as R-Square, homogeneity of variance and normality test) this is Q2 and my answer to it: Fit the simple linear regression model TIME = β0 + β1ENZ + ε. Write down the estimated regression function and examine the residual plot and normality test. Describe what you observed and make brief comments. Hint: you need to check the ANOVA table (that is the F-Statistic and its p-value on the last line of the summary(yourmodel) output)), parameter estimates tables, R-Square, residual plot and normality test. Coefficients: (Intercept) enz -108.716 3.967 TIME= -108.716 + 3.967 (ENZ) + ε By checking normality using the Shapiro-Wilk test, the p-value is 0.0000 less than 0.05. The null is rejected, and the data is not normally distributed.…
- :"RegressionIt is argued that less time spent on social media will result in improved course marks among ECO242 students. To test whether this is the case you collect data from 20 students on their final marks (Y) and number of facebook posts during the semester (X). You make the following calculations:∑XY=9057,∑X2=2470 ∑X = 190 ∑Y=1164Next, you run the following regression:marks=β^1+β^2facebookpostswhere 'marks' is the final mark for the course in percentage points, and 'facebookposts' is the number of facebook posts completed during the course. Question 1 .The value for the slope parameter is? Question 2 The value for the intercept parameter is? Question 3 If the standard error for the intercept parameter estimate is 1.43701, construct a 95% confidence interval for the parameter. Pr( ?. ≤β1≤ ?. . )=95% Question 4 .If the standard error for the slope parameter estimate is 0.129308, construct a 95% confidence interval for the parameter. Pr( ? ≤β2≤ ?. )=95% Questioion 5.Assuming…BUS – 173 (Applied Statistics) # Determining if the following statement are True and False. If False, write the correct statement. Also Solve the MCQ 01. The possible range of coefficient of determination (r^2) is 0 to 1 (a) True (b) False 02. The possible range of coefficient of correlation (r) is -1 to +1 (a) True (b) False 03. In the simple linear regression model, b represents the (a) least square estimate of A (b) least square estimate of B (c) Random error term (d) Not givenInterpret the least squares regression line of this data set. Meteorologists in a seaside town wanted to understand how their annual rainfall is affected by the temperature of coastal waters. For the past few years, they monitored the average temperature of coastal waters (in Celsius), x, as well as the annual rainfall (in millimetres), y. Rainfall statistics • The mean of the x-values is 11.503. • The mean of the y-values is 366.637. • The sample standard deviation of the x-values is 4.900. • The sample standard deviation of the y-values is 44.387. • The correlation coefficient of the data set is 0.896. The correct least squares regression line for the data set is: y = 8.116x + 273.273 Use it to complete the following sentence: The least squares regression line predicts an additional annual rainfall if the average temperature of coastal waters increases by one degree millimetres of Celsius.