
MATLAB: An Introduction with Applications
6th Edition
ISBN: 9781119256830
Author: Amos Gilat
Publisher: John Wiley & Sons Inc
expand_more
expand_more
format_list_bulleted
Related questions
Question
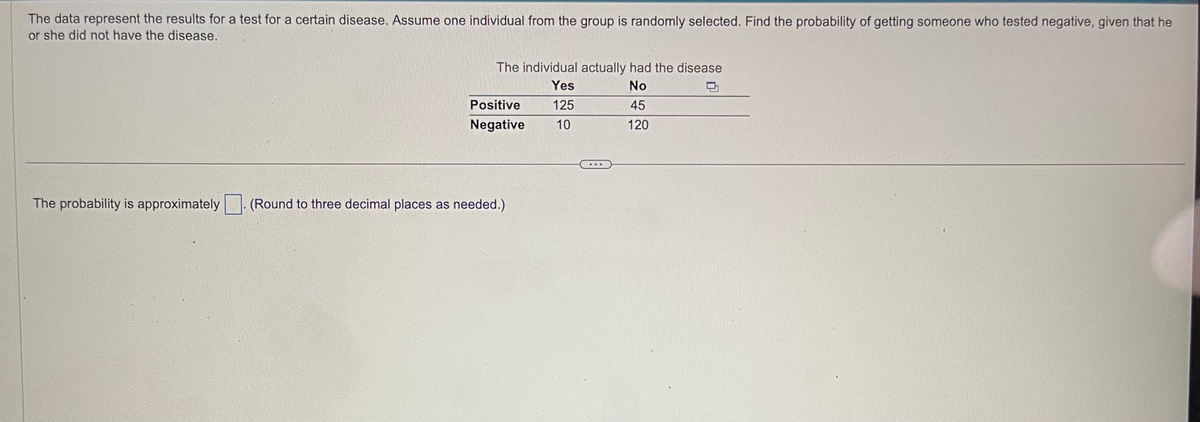

Transcribed Image Text:The data represent the results for a test for a certain disease. Assume one individual from the group is randomly selected. Find the probability of getting someone who tested negative, given that he
or she did not have the disease.
The probability is approximately
The individual actually had the disease
Yes
No
125
45
10
120
Positive
Negative
(Round to three decimal places as needed.)
Expert Solution
This question has been solved!
Explore an expertly crafted, step-by-step solution for a thorough understanding of key concepts.

Step by stepSolved in 3 steps with 1 images

Knowledge Booster

Similar questions
- The data represent the results for a test for a certain disease. Assume one individual from the group is randomly selected. Find the probability of getting someone who tested negative, given that he or she did not have the disease. The probability is approximately The individual actually had the disease Yes No 122 33 8 137 Positive Negative ... (Round to three decimal places as needed.)arrow_forwardUse the data in the following table, which lists drive-thru order accuracy at popular fast food chains. Assume that orders are randomly selected from those included in the table. Drive-thru Restaurant A B C D Order Accurate 315 262 247 120 Order Not Accurate 36 51 32 17 If one order is selected, find the probability of getting food that is not from Restaurant A. The probability of getting food that is not from Restaurant A is nothing. (Round to three decimal places as needed.)arrow_forwardUse the data in the following table, which lists drive-thru order accuracy at popular fast food chains. Assume that orders are randomly selected from those included in the table. Drive-thru Restaurant A B C D Order Accurate 333 268 233 147 Order Not Accurate 30 60 31 16 If one order is selected, find the probability of getting an order that is not accurate. The probability of getting an order that is not accurate is nothing. (Round to three decimal places as needed.)arrow_forward
- The data represent the results for a test for a certain disease. Assume one individual from the group is randomly selected. Find the probability of getting someone who tests negative, given that he or she did not have the disease. The individual actually had the disease Yes No Positive 127 18 Negative 34 121 The probability is approximately enter your response here. (Round to three decimal places as needed.)arrow_forwardThe data represent the results for a test for a certain disease. Assume one individual from the group is randomly selected. Find the probability of getting someone who tested positive, given that he or she did not have the disease. The individual actually had the disease No Positive Negative Yes 144 20 C The probability is approximately. (Round to three decimal places as needed.) 8 128arrow_forwardThe results for a blood test for a certain disease are shown in the table below. Based on the table, what is the prevalence of the disease? T+ T- Total D+ 290 10 300 D- 3219 481 3700 Total 3509 491 4000 A. 0.09 0.97 O B. 0.0725 290 Screenshotarrow_forward
- please help answerarrow_forwardUse the data in the following table, which lists drive-thru order accuracy at popular fast food chains. Assume that orders are randomly selected from those included in the table. Drive-thru Restaurant Order Accurate 328 276 235 140 Order Not Accurate 33 52 40 15 If one order is selected, find the probability of getting an order that is not accurate. The probability of getting an order that is not accurate is (Round to three decimal places as needed.) Enter your answer in the answer box. Next can 1:13 PM 7/25/2021 Acce today hp APPROVAL COD 137-2190-77 TOTAL CRE UP TO ACCE 08 home end ins prt sc delete t9 144 f8 f6 f5 f3 米 ? E backspace unu lock esc & 23 3 4 1 R T Y Q tab enter VIS KL H. A pause pcery ase caps lock 00 %24arrow_forwardCraig has a six sided number cube. He rolls the number cube 250 times and records the data in the table. Number on 1 2 3 4 5 Cube Number of Times 37 52 62 16 44 39 Appeared Based on the data shown, the probability of rolling which numbers have a larger theoretical probability than experimental probability? 1 6. 6. 5. 口ロ□□ □□arrow_forward
- Use the data in the following table, which lists drive-thru order accuracy at popular fast food chains. Assume that orders are randomly selected from those included in the table. If one order is selected, find the probability of getting food that is not from Restaurant A. The probability of getting food that is not from Restaurant A is (Round to three decimal places as needed.)arrow_forwardThe individual actually The data represent the results for a test for a certain disease. Assume one individual from the group is randomly selected. Find the probability of getting someone who tests positive, given that he or she had the disease did not have the disease. Yes No Positive 144 23 Negative 10 123 The probability is approximately 0.513. (Round to three decimal places as needed.)arrow_forwardThe correlation between midterm and final grades for 300 students is 0.620. If 5 points are added to each midterm grade, the new r will be: a. 0.124 b. 0.57 c. 0.62 d. 0.744arrow_forward
arrow_back_ios
SEE MORE QUESTIONS
arrow_forward_ios
Recommended textbooks for you
- MATLAB: An Introduction with ApplicationsStatisticsISBN:9781119256830Author:Amos GilatPublisher:John Wiley & Sons Inc
 Probability and Statistics for Engineering and th...StatisticsISBN:9781305251809Author:Jay L. DevorePublisher:Cengage Learning
 Statistics for The Behavioral Sciences (MindTap C...StatisticsISBN:9781305504912Author:Frederick J Gravetter, Larry B. WallnauPublisher:Cengage Learning
  Elementary Statistics: Picturing the World (7th E...StatisticsISBN:9780134683416Author:Ron Larson, Betsy FarberPublisher:PEARSON
 The Basic Practice of StatisticsStatisticsISBN:9781319042578Author:David S. Moore, William I. Notz, Michael A. FlignerPublisher:W. H. Freeman
 Introduction to the Practice of StatisticsStatisticsISBN:9781319013387Author:David S. Moore, George P. McCabe, Bruce A. CraigPublisher:W. H. Freeman
MATLAB: An Introduction with Applications
Statistics
ISBN:9781119256830
Author:Amos Gilat
Publisher:John Wiley & Sons Inc
Probability and Statistics for Engineering and th...
Statistics
ISBN:9781305251809
Author:Jay L. Devore
Publisher:Cengage Learning
Statistics for The Behavioral Sciences (MindTap C...
Statistics
ISBN:9781305504912
Author:Frederick J Gravetter, Larry B. Wallnau
Publisher:Cengage Learning
Elementary Statistics: Picturing the World (7th E...
Statistics
ISBN:9780134683416
Author:Ron Larson, Betsy Farber
Publisher:PEARSON
The Basic Practice of Statistics
Statistics
ISBN:9781319042578
Author:David S. Moore, William I. Notz, Michael A. Fligner
Publisher:W. H. Freeman
Introduction to the Practice of Statistics
Statistics
ISBN:9781319013387
Author:David S. Moore, George P. McCabe, Bruce A. Craig
Publisher:W. H. Freeman