
MATLAB: An Introduction with Applications
6th Edition
ISBN: 9781119256830
Author: Amos Gilat
Publisher: John Wiley & Sons Inc
expand_more
expand_more
format_list_bulleted
Related questions
Question

Transcribed Image Text:Higher Nationals
P Pearson I BTEC
III.
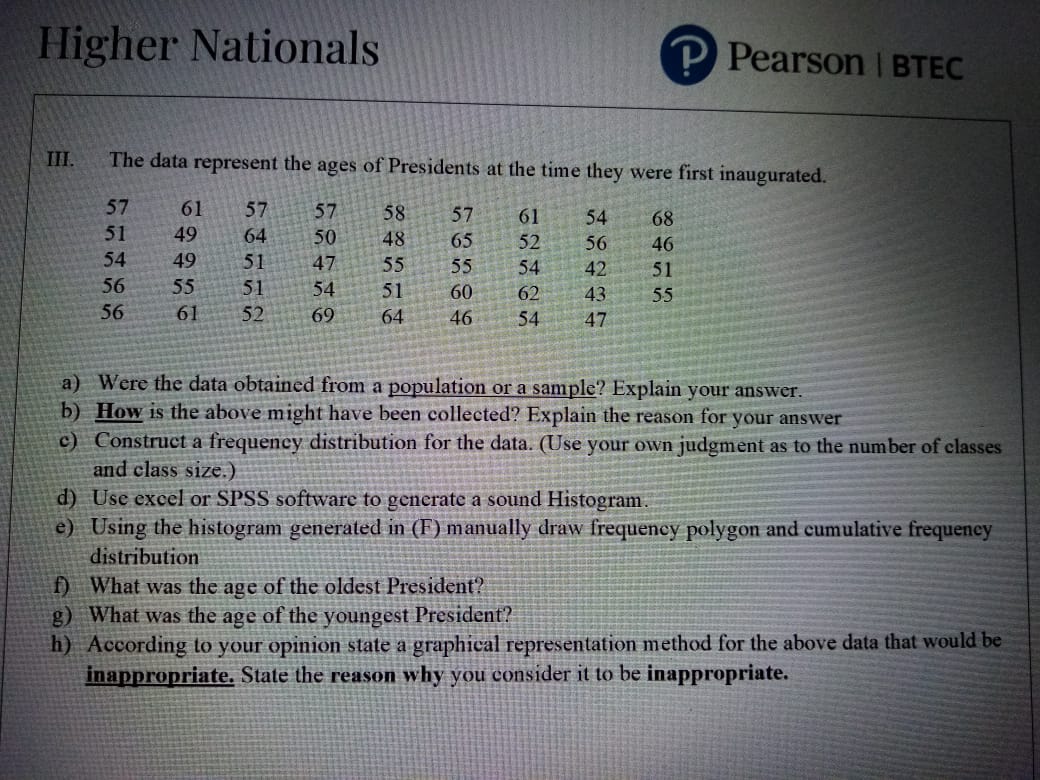
The data represent the ages of Presidents at the time they were first inaugurated.
57
61
57
57
58
57
61
54
68
51
49
64
50
48
65
52
56
46
54
49
51
47
55
55
54
42
51
56
55
51
54
51
60
62
43
55
56
61
52
69
64
46
54
47
a) Were the data obtained from a population or a sample? Explain your answer.
b) How is the above might have been collected? Explain the reason for your answer
c) Construct a frequency distribution for the data. (Use your own judgment as to the number of classes
and class size.)
d) Use excel or SPSS software to generate a sound Histogram
e) Using the histogram generated in (F) manually draw frequeney polygon and cumulative frequency
distribution
f) What was the age of the oldest President?
g) What was the age of the youngest President?
h) According to your opinion state a graphical representation method for the above data that would be
inappropriate. State the reason why you consider it to be inappropriate.
Expert Solution
This question has been solved!
Explore an expertly crafted, step-by-step solution for a thorough understanding of key concepts.

This is a popular solution

Trending nowThis is a popular solution!

Step by stepSolved in 3 steps

Knowledge Booster

Similar questions
- Score: 0/6 0/6 answered Question 1 The following data represents the age of 30 lottery winners. 23 29 29 32 37 37 38 38 39 42 43 45 45 46 47 48 57 58 58 59 64 65 67 68 71 72 73 75 79 82 Complete the frequency distribution for the data. Age Frequency 20-29 30-39 40-49 50-59 60-69 70-79 80-89 Question Help: Message instructor Submit Questionarrow_forwardThe following data represents the age of 30 lottery winners. 23 28 29 31 33 41 44 49 49 49 49 55 57 57 60 63 63 64 66 66 67 68 69 69 70 71 73 75 76 87 Complete the frequency distribution for the data. Age Frequency 20-29 30-39 40-49 50-59 60-69 70-79 A 80-89arrow_forwardThe following data represents the age of 30 lottery winners. 21 49 54 63 54 35 52 45 88 65 64 51 41 34 49 78 31 40 51 70 78 60 74 55 29 66 59 32 68 56 Complete the frequency distribution for the data. Bin Frequency 20-29 30-39 40-49 50-59 60-69 70-79 80-89arrow_forward
- The age of everyone who signed the declaration of independence is shown below. Is the data Discrete or Continuous? Create a frequency Table for the data. Draw an appropriate graph to display the data Describe the shape of the distribution.arrow_forwardThe following data represents the age of 30 lottery winners. 24 25 26 26 34 35 37 37 40 41 43 43 45 48 50 51 54 56 57 62 63 65 65 68 70 75 76 79 79 83 Complete the frequency distribution for the data. Age Frequency 20-29 30-39 40-49 50-59 60-69 70-79 80-89arrow_forwardThe following data represents the age of 30 lottery winners. 24 27 31 31 31 31 34 35 35 36 39 40 40 46 46 48 52 54 55 56 57 61 63 66 67 69 73 78 79 85 Complete the frequency distribution for the data. Age Frequency 20-29 30-39 40-49 50-59 60-69 70-79 80-89arrow_forward
arrow_back_ios
arrow_forward_ios
Recommended textbooks for you
- MATLAB: An Introduction with ApplicationsStatisticsISBN:9781119256830Author:Amos GilatPublisher:John Wiley & Sons Inc
 Probability and Statistics for Engineering and th...StatisticsISBN:9781305251809Author:Jay L. DevorePublisher:Cengage Learning
 Statistics for The Behavioral Sciences (MindTap C...StatisticsISBN:9781305504912Author:Frederick J Gravetter, Larry B. WallnauPublisher:Cengage Learning
  Elementary Statistics: Picturing the World (7th E...StatisticsISBN:9780134683416Author:Ron Larson, Betsy FarberPublisher:PEARSON
 The Basic Practice of StatisticsStatisticsISBN:9781319042578Author:David S. Moore, William I. Notz, Michael A. FlignerPublisher:W. H. Freeman
 Introduction to the Practice of StatisticsStatisticsISBN:9781319013387Author:David S. Moore, George P. McCabe, Bruce A. CraigPublisher:W. H. Freeman
MATLAB: An Introduction with Applications
Statistics
ISBN:9781119256830
Author:Amos Gilat
Publisher:John Wiley & Sons Inc
Probability and Statistics for Engineering and th...
Statistics
ISBN:9781305251809
Author:Jay L. Devore
Publisher:Cengage Learning
Statistics for The Behavioral Sciences (MindTap C...
Statistics
ISBN:9781305504912
Author:Frederick J Gravetter, Larry B. Wallnau
Publisher:Cengage Learning
Elementary Statistics: Picturing the World (7th E...
Statistics
ISBN:9780134683416
Author:Ron Larson, Betsy Farber
Publisher:PEARSON
The Basic Practice of Statistics
Statistics
ISBN:9781319042578
Author:David S. Moore, William I. Notz, Michael A. Fligner
Publisher:W. H. Freeman
Introduction to the Practice of Statistics
Statistics
ISBN:9781319013387
Author:David S. Moore, George P. McCabe, Bruce A. Craig
Publisher:W. H. Freeman