
MATLAB: An Introduction with Applications
6th Edition
ISBN: 9781119256830
Author: Amos Gilat
Publisher: John Wiley & Sons Inc
expand_more
expand_more
format_list_bulleted
Related questions
Question

Transcribed Image Text:不
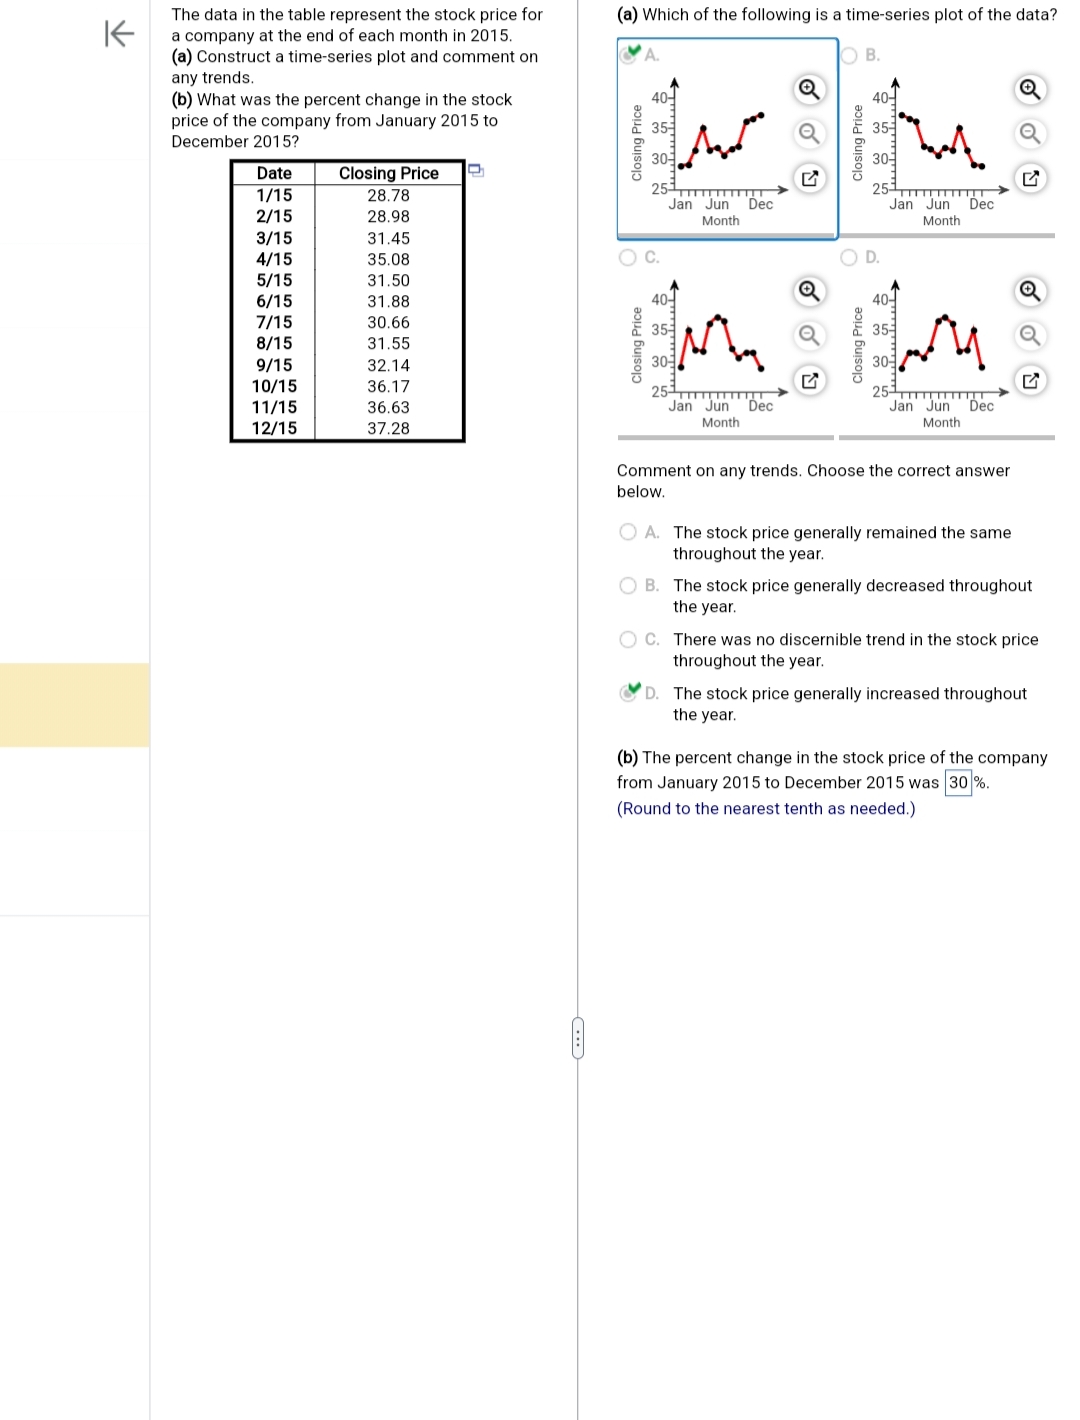
The data in the table represent the stock price for
a company at the end of each month in 2015.
(a) Construct a time-series plot and comment on
any trends.
(b) What was the percent change in the stock
price of the company from January 2015 to
December 2015?
Date
1/15
2/15
3/15
4/15
5/15
6/15
7/15
8/15
9/15
10/15
11/15
12/15
Closing Price D
28.78
28.98
31.45
35.08
31.50
31.88
30.66
31.55
32.14
36.17
36.63
37.28
(a) Which of the following is a time-series plot of the data?
OB.
Closing Price
Closing Price
40-
Andrea
Jan Jun Dec
Month
251
40-
30-
25TTT
Jan Jun
Month
Dec
Q
Closing Price
Closing Price
40-
251TT
Jan Jun
Month
Dec
Jan Jun Dec
Month
Comment on any trends. Choose the correct answer
below.
OA. The stock price generally remained the same
throughout the year.
Q
OB. The stock price generally decreased throughout
the year.
C. There was no discernible trend in the stock price
throughout the year.
D. The stock price generally increased throughout
the year.
(b) The percent change in the stock price of the company
from January 2015 to December 2015 was 30 %.
(Round to the nearest tenth as needed.)
Expert Solution
This question has been solved!
Explore an expertly crafted, step-by-step solution for a thorough understanding of key concepts.

This is a popular solution

Trending nowThis is a popular solution!

Step by stepSolved in 3 steps with 1 images

Knowledge Booster

Similar questions
- Quarterly Glass Container Demand Year 1990 1991 1992 First Qtr. 17,446. 17,748. 17,595. Second Qtr. 17,785. 19,360. 18,338. Third Qtr. 18,971. Fourth Qtr. 19140. 17,802. 19,413. 18,315. 18,083. Question: Quarterly sales (in thousands of units) of a product over the last two years have been 26, 29, 30, 27, 28, 32, 33, and 30. Plot the data and forecast for the next period using Winter's Seasonal Model. Now, assume sales for the ninth quarter turned out to be 32. Update your parameter estimates and forecast sales for period 10.arrow_forwardIt is claimed that Table 6 represents the seasonal factors obtained from a quarterly time series. Table 6 Quarter 1 2 3 4 Explain why this claim cannot be correct. Seasonal Factor -203.4 -81.6 24.1 -260.9arrow_forwardThe following data were taken from Miller Company's balance sheet: Dec. 31, Year 2 Dec. 31, Year 1 Total liabilities $150,000 $105,000 Total stockholders' equity 75,000 60,000 a. Compute the ratio of liabilities to stockholders' equity. Round your answers to one decimal place. Liabilities toStockholders' Equity 12/31/Year 2: fill in the blank 1 12/31/Year 1: fill in the blank 2 b. Has the creditors' risk increased or decreased from December 31, Year 1, to December 31, Year 2?arrow_forward
arrow_back_ios
arrow_forward_ios
Recommended textbooks for you
- MATLAB: An Introduction with ApplicationsStatisticsISBN:9781119256830Author:Amos GilatPublisher:John Wiley & Sons Inc
 Probability and Statistics for Engineering and th...StatisticsISBN:9781305251809Author:Jay L. DevorePublisher:Cengage Learning
 Statistics for The Behavioral Sciences (MindTap C...StatisticsISBN:9781305504912Author:Frederick J Gravetter, Larry B. WallnauPublisher:Cengage Learning
  Elementary Statistics: Picturing the World (7th E...StatisticsISBN:9780134683416Author:Ron Larson, Betsy FarberPublisher:PEARSON
 The Basic Practice of StatisticsStatisticsISBN:9781319042578Author:David S. Moore, William I. Notz, Michael A. FlignerPublisher:W. H. Freeman
 Introduction to the Practice of StatisticsStatisticsISBN:9781319013387Author:David S. Moore, George P. McCabe, Bruce A. CraigPublisher:W. H. Freeman
MATLAB: An Introduction with Applications
Statistics
ISBN:9781119256830
Author:Amos Gilat
Publisher:John Wiley & Sons Inc
Probability and Statistics for Engineering and th...
Statistics
ISBN:9781305251809
Author:Jay L. Devore
Publisher:Cengage Learning
Statistics for The Behavioral Sciences (MindTap C...
Statistics
ISBN:9781305504912
Author:Frederick J Gravetter, Larry B. Wallnau
Publisher:Cengage Learning
Elementary Statistics: Picturing the World (7th E...
Statistics
ISBN:9780134683416
Author:Ron Larson, Betsy Farber
Publisher:PEARSON
The Basic Practice of Statistics
Statistics
ISBN:9781319042578
Author:David S. Moore, William I. Notz, Michael A. Fligner
Publisher:W. H. Freeman
Introduction to the Practice of Statistics
Statistics
ISBN:9781319013387
Author:David S. Moore, George P. McCabe, Bruce A. Craig
Publisher:W. H. Freeman