
ENGR.ECONOMIC ANALYSIS
14th Edition
ISBN: 9780190931919
Author: NEWNAN
Publisher: Oxford University Press
expand_more
expand_more
format_list_bulleted
Related questions
Question
am. 136.
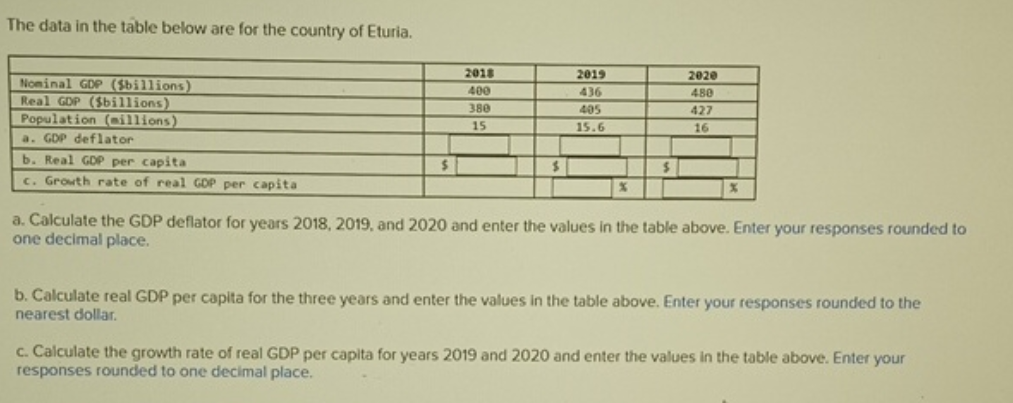

Transcribed Image Text:The data in the table below are for the country of Eturia.
Nominal GDP ($billions)
Real GDP ($billions)
Population (millions)
a. GDP deflator
b. Real GDP per capita
c. Growth rate of real GDP per capita
2018
2019
2020
400
436
480
380
405
427
15
15.6
16
$
$
%
a. Calculate the GDP deflator for years 2018, 2019, and 2020 and enter the values in the table above. Enter your responses rounded to
one decimal place.
b. Calculate real GDP per capita for the three years and enter the values in the table above. Enter your responses rounded to the
nearest dollar.
c. Calculate the growth rate of real GDP per capita for years 2019 and 2020 and enter the values in the table above. Enter your
responses rounded to one decimal place.
Expert Solution
This question has been solved!
Explore an expertly crafted, step-by-step solution for a thorough understanding of key concepts.

Step by stepSolved in 2 steps with 3 images

Knowledge Booster

Similar questions
- a b and c pleasearrow_forwardA large company in the communication and publishing industry hs quantified the relationship between the price of one of its products and the demand for this product as Price = 160 -0.01 xDemand for an annual printing of this particular product. The foxed costs per year (ie. per printing) = $4T 000 and the variable cost per unit = $35. What is the maximum profit that can be achieved? What is the unit price at this point of optimal demand? Demand is not expected to be more than 7,000 units per year. The maximum profit that can be achieved is S. (Round to the nearest dolar.) The unit price at the point of optimal demand is S per unit (Round to the nearest cent)arrow_forwardI need help with this question pleasearrow_forward
- Hhe paypil prbeluces. Drive the first orler Condition of Maximization for lutemediate gad with respect to Pel) Peti -MCttiarrow_forwardA time-study technician at the Southern Textile Companyhas conducted a time study of a spinning machine operatorthat spins rough cotton yarn into a finer yarn on bobbins foruse in a weaving operation. The time study was requestedas the result of a union grievance. The average cycle time for the operator to replace all the full bobbins on the ma-chine with empty bobbins was 3.62 minutes. The technician assigned an overall performance rating for the job of 100%,and the allowance factor specified by the union contract is15%. Compute the standard time for this job.arrow_forwardAn electronics company makes communications devices for military contracts. The company just completed a large contract. The Army contract was for 6808 devices that were produced by 43 workers in three weeks. Each worker worked 40 hours per week. What was the prductivity for the ARMY contact in devices per labour hour? (State your answer rounded to two decimal places)arrow_forward
- The following figure represents the Marginal Abatement Cost curves of two paper towel factories: Unbleached Factory, Number 1 and Bleached Factory, Number 2 in the figure. Their MAC functions are: MAC1 = 61.5E1 and MAC2 = 6 -0.75E2 E1 and E2 are the emissions of the two firms in tonnes.arrow_forwardQstn 2. Maximize U= 2X1X2+X2 Subject to 100=P1Xi+P2X2.arrow_forwardFind the equilbrium Y when C = 300 + 0.8Y and I = 1000arrow_forward
- If a TV show has a rating of 8.0/16.0 what does it mean? а. 8% of all televisions in use at the time were tuned to that show, and 16% of all households with a TV were tuned to that show b. 50% of all households with a TV set were tuned to that show с. 8% of all households with a TV set were tuned to that show and 16% of all televisions in use at the time were tuned to that show d. 50% of all televisions in use at the time were tuned to that showarrow_forwardA company manufactures two types of typewriters-electrical (E) and manual (M). The revenue function of the company, in thousands is: R(E, M) = 8E + 5M + 2EM – E² – 2M² + 20. Determine the quantity of electrical and manual typewriters which lead to maximum revenue. Also calculate the maximum revenue.arrow_forwardWindhoch Maulacture Company son a government tender to manufacture nurse's uniform. Recently, hindhekh Manulaqure Commpon, hired an economist to estimatk its cost function For proclucing nursels unitho. The estimated cosk funChonis: TC=400Q-5007504here Q is the quantity of nurse's. luniform podiced l0oWhat is the level of auput at which the poduction. 6e the uniform minimizes the ATCP companysarrow_forward
arrow_back_ios
arrow_forward_ios
Recommended textbooks for you
 Principles of Economics (12th Edition)EconomicsISBN:9780134078779Author:Karl E. Case, Ray C. Fair, Sharon E. OsterPublisher:PEARSON
 Engineering Economy (17th Edition)EconomicsISBN:9780134870069Author:William G. Sullivan, Elin M. Wicks, C. Patrick KoellingPublisher:PEARSON
 Principles of Economics (MindTap Course List)EconomicsISBN:9781305585126Author:N. Gregory MankiwPublisher:Cengage Learning
 Managerial Economics: A Problem Solving ApproachEconomicsISBN:9781337106665Author:Luke M. Froeb, Brian T. McCann, Michael R. Ward, Mike ShorPublisher:Cengage Learning
 Managerial Economics & Business Strategy (Mcgraw-...EconomicsISBN:9781259290619Author:Michael Baye, Jeff PrincePublisher:McGraw-Hill Education
Principles of Economics (12th Edition)
Economics
ISBN:9780134078779
Author:Karl E. Case, Ray C. Fair, Sharon E. Oster
Publisher:PEARSON
Engineering Economy (17th Edition)
Economics
ISBN:9780134870069
Author:William G. Sullivan, Elin M. Wicks, C. Patrick Koelling
Publisher:PEARSON
Principles of Economics (MindTap Course List)
Economics
ISBN:9781305585126
Author:N. Gregory Mankiw
Publisher:Cengage Learning
Managerial Economics: A Problem Solving Approach
Economics
ISBN:9781337106665
Author:Luke M. Froeb, Brian T. McCann, Michael R. Ward, Mike Shor
Publisher:Cengage Learning
Managerial Economics & Business Strategy (Mcgraw-...
Economics
ISBN:9781259290619
Author:Michael Baye, Jeff Prince
Publisher:McGraw-Hill Education