
MATLAB: An Introduction with Applications
6th Edition
ISBN: 9781119256830
Author: Amos Gilat
Publisher: John Wiley & Sons Inc
expand_more
expand_more
format_list_bulleted
Related questions
Question
Show work. Details in document.

Transcribed Image Text:11:29 AM Sun Nov 5
<
Number 1
3
16
32
41
58
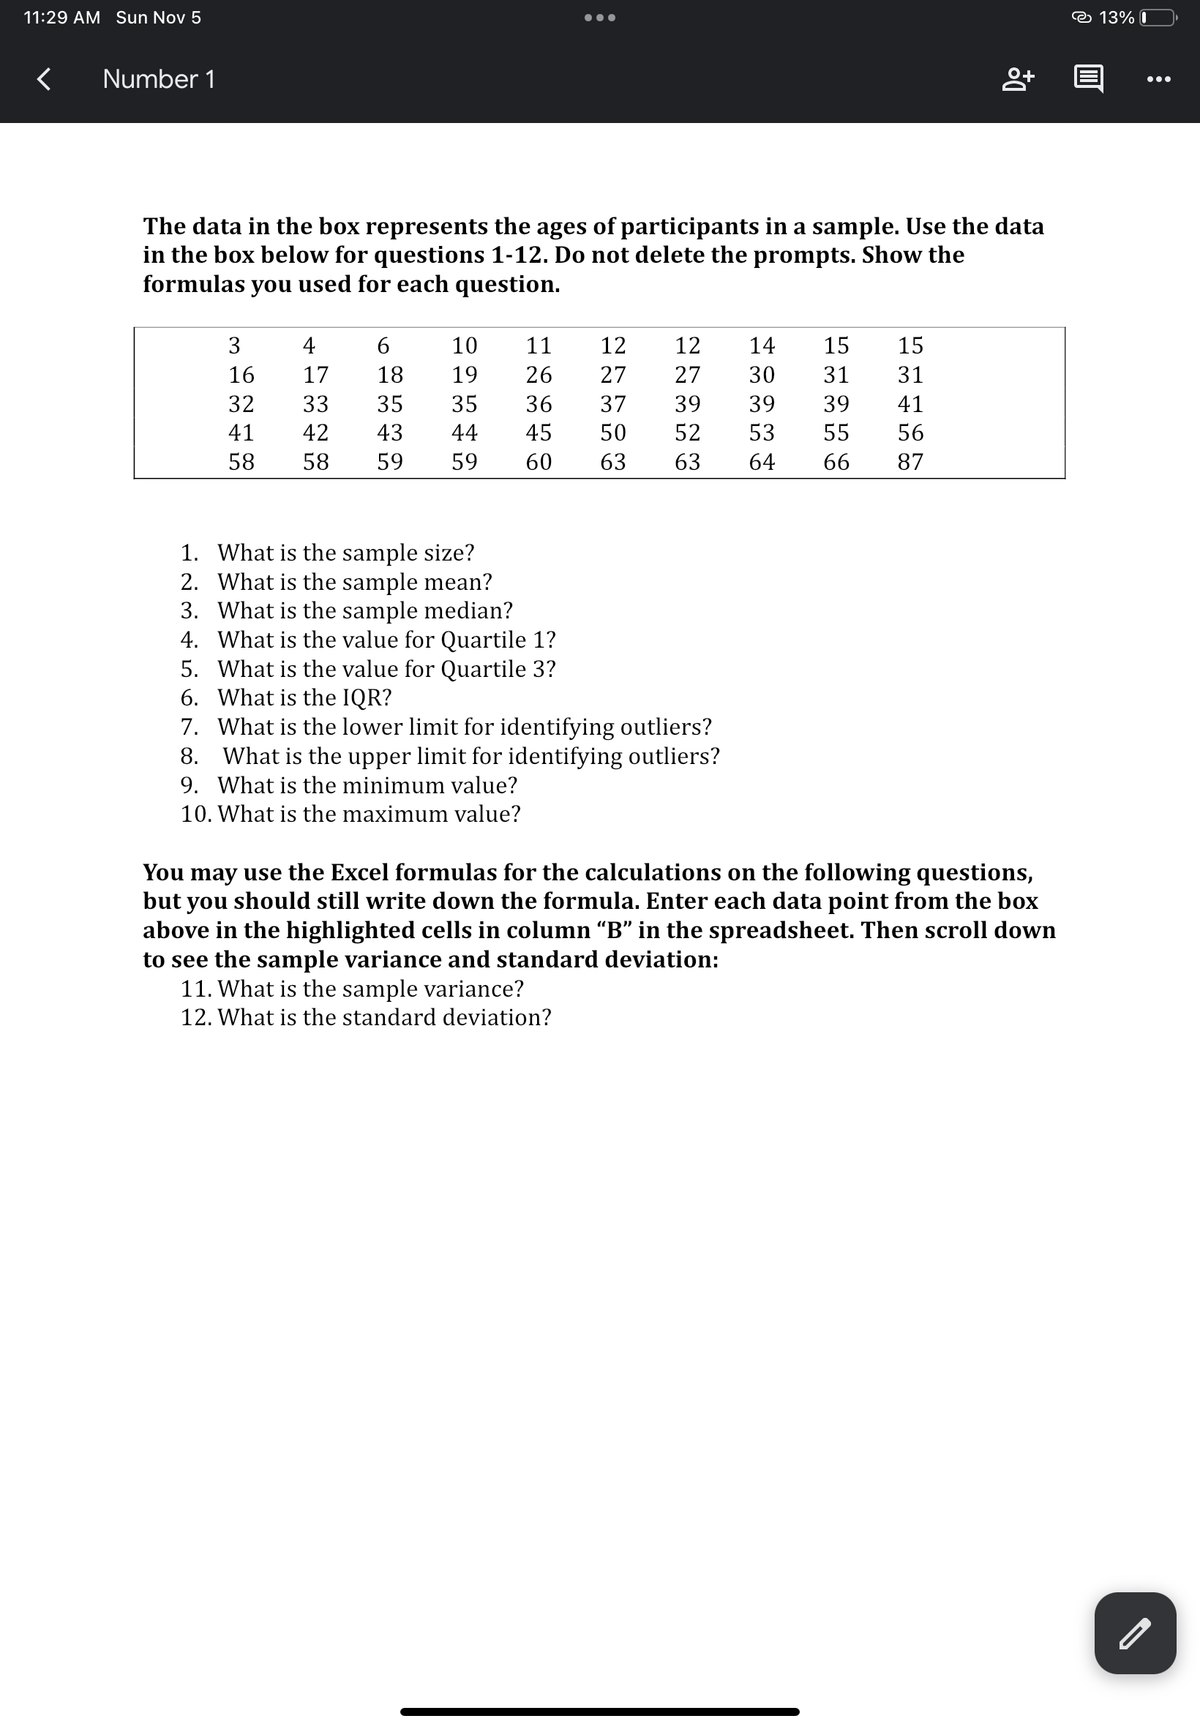
The data in the box represents the ages of participants in a sample. Use the data
in the box below for questions 1-12. Do not delete the prompts. Show the
formulas you used for each question.
4
6
17
18
33
35
42 43
58 59
●●●
10
11
19
26
35 36
44
45
59
60 63
12 12 14 15
27 27 30 31
39 39
50 52 53 55
37
39
63
64
1. What is the sample size?
2. What is the sample mean?
3. What is the sample median?
4. What is the value for Quartile 1?
5. What is the value for Quartile 3?
6. What is the IQR?
7. What is the lower limit for identifying outliers?
8. What is the upper limit for identifying outliers?
9. What is the minimum value?
10. What is the maximum value?
11. What is the sample variance?
12. What is the standard deviation?
8+
15
31
41
56
66 87
You may use the Excel formulas for the calculations on the following questions,
but you should still write down the formula. Enter each data point from the box
above in the highlighted cells in column “B” in the spreadsheet. Then scroll down
to see the sample variance and standard deviation:
13% 0
:
●●●
Expert Solution
This question has been solved!
Explore an expertly crafted, step-by-step solution for a thorough understanding of key concepts.

Step by stepSolved in 3 steps with 2 images

Knowledge Booster

Similar questions
arrow_back_ios
SEE MORE QUESTIONS
arrow_forward_ios
Recommended textbooks for you
- MATLAB: An Introduction with ApplicationsStatisticsISBN:9781119256830Author:Amos GilatPublisher:John Wiley & Sons Inc
 Probability and Statistics for Engineering and th...StatisticsISBN:9781305251809Author:Jay L. DevorePublisher:Cengage Learning
 Statistics for The Behavioral Sciences (MindTap C...StatisticsISBN:9781305504912Author:Frederick J Gravetter, Larry B. WallnauPublisher:Cengage Learning
  Elementary Statistics: Picturing the World (7th E...StatisticsISBN:9780134683416Author:Ron Larson, Betsy FarberPublisher:PEARSON
 The Basic Practice of StatisticsStatisticsISBN:9781319042578Author:David S. Moore, William I. Notz, Michael A. FlignerPublisher:W. H. Freeman
 Introduction to the Practice of StatisticsStatisticsISBN:9781319013387Author:David S. Moore, George P. McCabe, Bruce A. CraigPublisher:W. H. Freeman
MATLAB: An Introduction with Applications
Statistics
ISBN:9781119256830
Author:Amos Gilat
Publisher:John Wiley & Sons Inc
Probability and Statistics for Engineering and th...
Statistics
ISBN:9781305251809
Author:Jay L. Devore
Publisher:Cengage Learning
Statistics for The Behavioral Sciences (MindTap C...
Statistics
ISBN:9781305504912
Author:Frederick J Gravetter, Larry B. Wallnau
Publisher:Cengage Learning
Elementary Statistics: Picturing the World (7th E...
Statistics
ISBN:9780134683416
Author:Ron Larson, Betsy Farber
Publisher:PEARSON
The Basic Practice of Statistics
Statistics
ISBN:9781319042578
Author:David S. Moore, William I. Notz, Michael A. Fligner
Publisher:W. H. Freeman
Introduction to the Practice of Statistics
Statistics
ISBN:9781319013387
Author:David S. Moore, George P. McCabe, Bruce A. Craig
Publisher:W. H. Freeman