MATLAB: An Introduction with Applications
6th Edition
ISBN: 9781119256830
Author: Amos Gilat
Publisher: John Wiley & Sons Inc
expand_more
expand_more
format_list_bulleted
Question

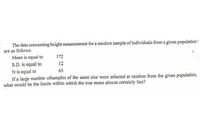
Transcribed Image Text:The data concerning height measurement for a random sample of individuals from a given population
are as follows:
Mean is equal to
172
S.D. is equal to
N is equal to
If a large number ofsamples of the same size were selected at random from the given population,
what would be the limits within which the true mean almost certainly lies?
12
65
Expert Solution
This question has been solved!
Explore an expertly crafted, step-by-step solution for a thorough understanding of key concepts.
This is a popular solution
Trending nowThis is a popular solution!
Step by stepSolved in 3 steps with 3 images

Knowledge Booster
Similar questions
- Which of the following is a good point estimator for the population mean? O S O 2 42 S 2 X I.arrow_forwardSuppose that for a test of proportion we have :p=0.5 and . The test statistic z=1.53 and the p-value is reported as P-value = 0.063. Find the error in the reasoning. This is a right-tailed test so the P-value should be 0.9370. This is a two-tailed test so the P-value should be 0.126. The P-value should have been calculated using the studentâ s t-distribution. There is no error in the reasoning. None of these.arrow_forwardFor questions 6 through 11, refer to the following table, representing responses from the 2018 GSS: Respondent Sex Mean Hours Worked Last Week Standard Deviation N Male 44.60 14.969 670 Female 38.15 13.276 711 6. What proportion of females worked less than 40 hours per week? a. How many people in the sample does that correspond to?7. What percentage of males worked between 40 and 50 hours per week? a. How many people in the sample does that correspond to?8. What number of hours worked among females corresponds with a Z score of -2.00?9. Calculate the number of hours worked last week that corresponds to the 95th percentile for each sex. a. If you were going to calculate the 75th percentile, what Z value would you use? 10. Calculate the standard error for both males and females. a. What are you using for sigma, and why? 11. Calculate the 95% confidence interval for each sex. Can you say with 95% confidence that they are different? Why or why not? a. If you were…arrow_forward
- What is the mean squar error for the followin data set x y -2 4 -1 2 0 2 1 1 2 1arrow_forwardA company decides to investigate the amount of sick leave taken by its employees. A sample of seven employees yields the following numbers of days of sick leave taken in the past year. 1 1 3 0 0 63 Use this information to answer parts a through c. a. Find and interpret the range. The range is 6 days. Choose the correct interpretation of the range below. A. The largest difference between the mean and any other value is equal to the range. B. The number of days separating the fewest and most sick days taken is equal to the range. C. The range represents the average distance of an observation from the mean. D. The range gives the most useful value for measuring the spread of the data.arrow_forwardWhich of the following statements is not true? There is only one median for each variable. One definition of the median states that, for an odd number of observations, the median is the middle score when scores are placed in order of magnitude. Another term for the median is 50th percentile. The median is generally more sensitive to (i.e., affected by) the presence of a few extreme observations than is the mean.arrow_forward
arrow_back_ios
arrow_forward_ios
Recommended textbooks for you
 MATLAB: An Introduction with ApplicationsStatisticsISBN:9781119256830Author:Amos GilatPublisher:John Wiley & Sons Inc
 Probability and Statistics for Engineering and th...StatisticsISBN:9781305251809Author:Jay L. DevorePublisher:Cengage Learning
 Statistics for The Behavioral Sciences (MindTap C...StatisticsISBN:9781305504912Author:Frederick J Gravetter, Larry B. WallnauPublisher:Cengage Learning
 Elementary Statistics: Picturing the World (7th E...StatisticsISBN:9780134683416Author:Ron Larson, Betsy FarberPublisher:PEARSON
 The Basic Practice of StatisticsStatisticsISBN:9781319042578Author:David S. Moore, William I. Notz, Michael A. FlignerPublisher:W. H. Freeman
 Introduction to the Practice of StatisticsStatisticsISBN:9781319013387Author:David S. Moore, George P. McCabe, Bruce A. CraigPublisher:W. H. Freeman

MATLAB: An Introduction with Applications
Statistics
ISBN:9781119256830
Author:Amos Gilat
Publisher:John Wiley & Sons Inc

Probability and Statistics for Engineering and th...
Statistics
ISBN:9781305251809
Author:Jay L. Devore
Publisher:Cengage Learning

Statistics for The Behavioral Sciences (MindTap C...
Statistics
ISBN:9781305504912
Author:Frederick J Gravetter, Larry B. Wallnau
Publisher:Cengage Learning

Elementary Statistics: Picturing the World (7th E...
Statistics
ISBN:9780134683416
Author:Ron Larson, Betsy Farber
Publisher:PEARSON

The Basic Practice of Statistics
Statistics
ISBN:9781319042578
Author:David S. Moore, William I. Notz, Michael A. Fligner
Publisher:W. H. Freeman

Introduction to the Practice of Statistics
Statistics
ISBN:9781319013387
Author:David S. Moore, George P. McCabe, Bruce A. Craig
Publisher:W. H. Freeman