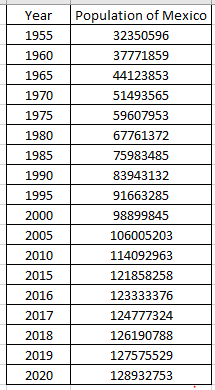
The data below is from https://www.worldometers.info/world-population/mexico-population/
|
Year |
Population of Mexico |
|
2020 |
128,932,753 |
|
2019 |
127,575,529 |
|
2018 |
126,190,788 |
|
2017 |
124,777,324 |
|
2016 |
123,333,376 |
|
2015 |
121,858,258 |
|
2010 |
114,092,963 |
|
2005 |
106,005,203 |
|
2000 |
98,899,845 |
|
1995 |
91,663,285 |
|
1990 |
83,943,132 |
|
1985 |
75,983,485 |
|
1980 |
67,761,372 |
|
1975 |
59,607,953 |
|
1970 |
51,493,565 |
|
1965 |
44,123,853 |
|
1960 |
37,771,859 |
|
1955 |
32,350,596 |
1.. Show how you can verify that your linear model works for this data. (Keep trying until it works, and then come back and prove that it works here.)
2. Use your linear model to predict the population in 2050. Show work, sentence answer.
3. Explain whether you think a linear model is a reasonable approximation. Give specific reasons for your answer.
1)
Given data of Year and respective population in Mexico as shown below
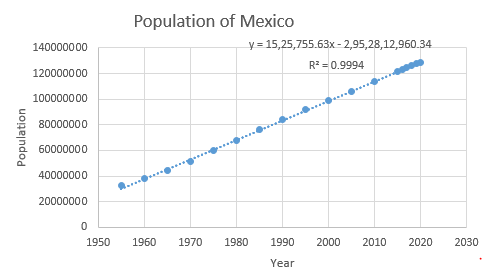
The scatter plot of the data is plotted using excel and Inserted a trend line and the equation of best fit line and its value of Coefficient of determination as shown below.
1. First enter the given data in excel
2. Insert a scatter plot by selecting data and add trend line through Chart elements then display the equation of trend line and R^2 coefficient of determination, we get the following
With reference to plot we can clearly see the data form a straight line . Thus we have strong evidence that the relationship is linear and the linear model is
where x is the year and y is the population in Mexico.
Step by stepSolved in 2 steps with 2 images

- The following are the annual incomes (in thousands of dollars) for 24 randomly chosen, U.S. adults employed full-time. 28, 31, 32, 33, 34, 36, 38, 38, 38, 38, 41, 42, 43, 43, 44, 47, 48, 50, 54, 55, 61, 82, 96, 107 Send data to calculator Send data to Excel Frequency 15 10+ 15 6 5. 25 45 65 1 1 1 85 105 125 Annual income (in thousands of dollars) Answer the questions below. (a) For these data, which measures of central tendency take more than one value? Choose all that apply. Mean Median Mode ☐ None of these measures Mean (b) Suppose that the measurement 28 (the smallest measurement in the data set) were ☐ Median replaced by 10 Which measures of centralarrow_forwardState at least 5 questions assessing demographic variables and state what kind of descriptive statistics you can obtain.arrow_forwardForecast the average number of viewers during the 2009 season using a three-period weighted moving average with weights 3, 2, and 1, applying 3 to the most recent data and 1 to the oldest data.arrow_forward
- Identify statistics idenrify parrow_forwardHow to draw bar chart using R code? Thanks.arrow_forwardTop 50 Metro Areas by Population: Personal Income, Population, Per Capita Personal Income Rank Metro GeoName Total Metro Personal Income 2020 (000s) Per Capita Personal Income 2020 Population 2020 (millions) # of NFL, NBA, MLB, NHL teams 1 New York-Newark-Jersey City, NY-NJ-PA 1574364671 82322 19.124359 9 2 Los Angeles-Long Beach-Anaheim, CA 915132543 69805 13.109903 6 3 Chicago-Naperville-Elgin, IL-IN-WI 636555184 67671 9.406638 5 4 Dallas-Fort Worth-Arlington, TX 473604117 61554 7.694138 4 5 Houston-The Woodlands-Sugar Land, TX 428500645 59893 7.154478 3 6 Washington-Arlington-Alexandria, DC-VA-MD-WV 485550913 76771 6.324629 4 7 Miami-Fort Lauderdale-Pompano Beach, FL 396247347 64190 6.173008 4 8 Philadelphia-Camden-Wilmington, PA-NJ-DE-MD 425748748 69705 6.107906 4 9 Atlanta-Sandy Springs-Alpharetta, GA 357795984 58773 6.087762 3 10 Phoenix-Mesa-Chandler, AZ 262362901 51851 5.059909 4 11…arrow_forward
- https://www.webassign.net/aswsbe13/appendix-b.pdfarrow_forwardHELP PLEASE URGENT!!! Thanksarrow_forwardA survey of 22 retirees was taken. Among other things, the retirees were asked to report the age at which they retired. Here are those 22 ages (in years). 35, 42, 43, 46, 54, 55, 55, 57, 61, 61, 61, 62, 64, 66, 67, 69, 69, 72, 72, 73, 73, 77 Send data to calculator Send data to Excel Frequency 10- 6. 8 6- 4 4 2- 1. 60 70 40 Age (in years) 30 50 80 3.arrow_forward
- 4. Which data set fits the following five-number summary? 318, 322, 326.5, 332, 339 326, 322, 338, 337, 326, 328, 320, 332, 321, 322, 327, 332, 332, 338 337, 332, 327, 321, 338, 339, 332, 322, 336, 326, 327, 321, 328, 318 326, 337, 338, 328, 332, 322, 321, 332, 339, 327, 318, 326, 322, 322 O 318, 332, 332, 326, 322, 328, 321, 322, 326, 327, 337arrow_forwardQuestion and data are attached as images. Thank you and will give thumbs up! Data is typed below as well. Non_Stop_Flights one_Stop_flights 1434.9 1556.2 1653.18 1549.33 1617.95 1511.14 1668.19 1497.84 1809.16 1882.04 1641.15 1600.5 1494.61 1699.01 1776.6 1582.12 1894.51 1502.09arrow_forwardWhat is the approximate forecast for November using a four-month moving average? Oct - 700Sept - 600Aug - 880July - 670June - 430arrow_forward
 MATLAB: An Introduction with ApplicationsStatisticsISBN:9781119256830Author:Amos GilatPublisher:John Wiley & Sons Inc
 Probability and Statistics for Engineering and th...StatisticsISBN:9781305251809Author:Jay L. DevorePublisher:Cengage Learning
 Statistics for The Behavioral Sciences (MindTap C...StatisticsISBN:9781305504912Author:Frederick J Gravetter, Larry B. WallnauPublisher:Cengage Learning
 Elementary Statistics: Picturing the World (7th E...StatisticsISBN:9780134683416Author:Ron Larson, Betsy FarberPublisher:PEARSON
 The Basic Practice of StatisticsStatisticsISBN:9781319042578Author:David S. Moore, William I. Notz, Michael A. FlignerPublisher:W. H. Freeman
 Introduction to the Practice of StatisticsStatisticsISBN:9781319013387Author:David S. Moore, George P. McCabe, Bruce A. CraigPublisher:W. H. Freeman


