MATLAB: An Introduction with Applications
6th Edition
ISBN: 9781119256830
Author: Amos Gilat
Publisher: John Wiley & Sons Inc
expand_more
expand_more
format_list_bulleted
Question

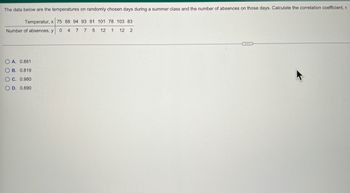
Transcribed Image Text:### Temperature and Absences in a Summer Class
The following data represents the temperatures on randomly chosen days during a summer class and the corresponding number of absences on those days. Use this data to calculate the correlation coefficient, \( r \).
#### Data Table:
| Temperature, \( x \) | 75 | 88 | 94 | 93 | 91 | 101 | 78 | 103 | 83 |
|-----------------------|----|----|----|----|----|-----|----|-----|----|
| Number of absences, \( y \) | 0 | 4 | 7 | 7 | 5 | 12 | 1 | 12 | 2 |
#### Available Answers:
- **A.** 0.881
- **B.** 0.819
- **C.** 0.980
- **D.** 0.890
Calculate the correlation coefficient \( r \) to determine the strength and direction of the relationship between temperature and the number of absences. Select the correct answer from the options provided.
Expert Solution
This question has been solved!
Explore an expertly crafted, step-by-step solution for a thorough understanding of key concepts.
Step by stepSolved in 2 steps with 2 images

Knowledge Booster
Similar questions
- Listed below are the budgets (in millions of dollars) and the gross receipts (in millions of dollars) for randomly selected movies. Answer parts a-c. Budget (x) Gross (y)60 6091 6050 4839 62193 558105 14087 52 a. Find the value of the linear correlation coefficient r.arrow_forwardAnnual high temperatures in a certain location have been tracked for several years. Let XX represent the year and YY the high temperature. Based on the data shown below, calculate the correlation coefficient (to three decimal places) between XX and YY. Use your calculator! x y 2 16.7 3 13.74 4 14.78 5 14.32 6 14.66 7 13.4 r=arrow_forwardBased on the data shown below, calculate the correlation coefficient (to three decimal places) X y 87 82.8 7 87.8 8 88.6 9. 86.6 10 91.8 11 91.8 12 88.4 Question Help: DVideo MMessage instructor Submit Question 目 Chp -> Co & 5 7 60 96 4arrow_forward
- The data below are the final exam scores of 10 randomly selected statistics students and the number of hours they studied for the exam. Calculate the correlation coefficient r. Hours, x 1 3 0 6 0 2 2 3 4 1 Scores, y 67 82 62 90 68 80 87 92 92 73 Question content area bottom Part 1 A. 0.991 B. 0.847 C. 0.761 D. 0.654arrow_forwardFor a data set of chest sizes (distance around chest in inches) and weights (pounds) of eight anesthetized bears that were measured, the linear correlation coefficient is r = 0.996. Use the table available below to find the critical values of r. Number of Pairs of Data n Critical Value of r 4 0.950 0.878 0.811 7 0.754 8. 0.707 9. 0.666 10 0.632 11 0.602 12 0.576 А. -0.707, +0.707 В. +0.707 С. +0.754 D. -0.707arrow_forwardThe data below are the final exam scores of 10 randomly selected calculus students and the number of hours they slept the night before the exam. Calculate the linear correlation coefficient. Round to three decimal places. Hours, x Scores, y OA. 0.654 OB. 0.847 O C. 0.761 O D. 0.991 7 74 9 89 6 69 12 97 6 75 8 87 8 94 9 10 99 99 7 80 …….arrow_forward
arrow_back_ios
arrow_forward_ios
Recommended textbooks for you
 MATLAB: An Introduction with ApplicationsStatisticsISBN:9781119256830Author:Amos GilatPublisher:John Wiley & Sons Inc
 Probability and Statistics for Engineering and th...StatisticsISBN:9781305251809Author:Jay L. DevorePublisher:Cengage Learning
 Statistics for The Behavioral Sciences (MindTap C...StatisticsISBN:9781305504912Author:Frederick J Gravetter, Larry B. WallnauPublisher:Cengage Learning
 Elementary Statistics: Picturing the World (7th E...StatisticsISBN:9780134683416Author:Ron Larson, Betsy FarberPublisher:PEARSON
 The Basic Practice of StatisticsStatisticsISBN:9781319042578Author:David S. Moore, William I. Notz, Michael A. FlignerPublisher:W. H. Freeman
 Introduction to the Practice of StatisticsStatisticsISBN:9781319013387Author:David S. Moore, George P. McCabe, Bruce A. CraigPublisher:W. H. Freeman

MATLAB: An Introduction with Applications
Statistics
ISBN:9781119256830
Author:Amos Gilat
Publisher:John Wiley & Sons Inc

Probability and Statistics for Engineering and th...
Statistics
ISBN:9781305251809
Author:Jay L. Devore
Publisher:Cengage Learning

Statistics for The Behavioral Sciences (MindTap C...
Statistics
ISBN:9781305504912
Author:Frederick J Gravetter, Larry B. Wallnau
Publisher:Cengage Learning

Elementary Statistics: Picturing the World (7th E...
Statistics
ISBN:9780134683416
Author:Ron Larson, Betsy Farber
Publisher:PEARSON

The Basic Practice of Statistics
Statistics
ISBN:9781319042578
Author:David S. Moore, William I. Notz, Michael A. Fligner
Publisher:W. H. Freeman

Introduction to the Practice of Statistics
Statistics
ISBN:9781319013387
Author:David S. Moore, George P. McCabe, Bruce A. Craig
Publisher:W. H. Freeman