Advanced Engineering Mathematics
10th Edition
ISBN: 9780470458365
Author: Erwin Kreyszig
Publisher: Wiley, John & Sons, Incorporated
expand_more
expand_more
format_list_bulleted
Question
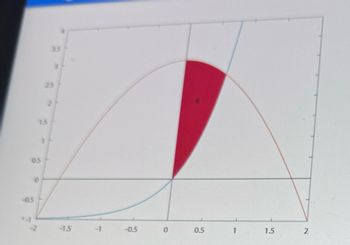
The curves f(x)= 3-x^2 and g(x) =e^(2x)-1 are shown in the figure. Let R be the shaded region bounded by the graph of f (x), g(x) and the y-axis. Find the volume of the solid generated when R is rotated about the x-axis.

Transcribed Image Text:The image presents a mathematical graph featuring two curves and a shaded region labeled 'R'.
### Graph Details:
- **Axes:**
- **Horizontal Axis (x-axis):** Ranges from -2 to 2 with ticks at intervals of 0.5.
- **Vertical Axis (y-axis):** Ranges from -1 to 3.5 with ticks at intervals of 0.5.
- **Curves:**
- The **blue curve** starts from the lower-left corner and moves upward, likely representing an exponential or logarithmic function, crossing the x-axis near the point (0,0).
- The **brown curve** forms an inverted parabola, peaking above the x-axis at around the midpoint.
- **Shaded Region:**
- The area marked as 'R' is shaded in red, situated between the two curves. This region is bound by the curves and vertical lines at approximately \( x = 0 \) and \( x = 1.5 \).
### Explanation:
The diagram likely illustrates the integration or area calculation between two curves over a specified interval. The shaded region 'R' is of interest for determining the area between the curves, which may be computed using integral calculus methods for applications in mathematics or physics.
Expert Solution
This question has been solved!
Explore an expertly crafted, step-by-step solution for a thorough understanding of key concepts.
Step by stepSolved in 4 steps with 3 images

Knowledge Booster
Similar questions
- How do you find the upper and lower limit of an integral volume equation?arrow_forwardFind the volume of the region above the triangle with vertices (1,0), (0,1) and (3,1), below the surface f(x, y) =x^2y.arrow_forwardsketch the solid and a washer for the graph of these two functions f(x) =2 -(x-2)^2, g(x)=-x after rotating the enclosed region around the line y=1arrow_forward
Recommended textbooks for you
 Advanced Engineering MathematicsAdvanced MathISBN:9780470458365Author:Erwin KreyszigPublisher:Wiley, John & Sons, Incorporated
 Numerical Methods for EngineersAdvanced MathISBN:9780073397924Author:Steven C. Chapra Dr., Raymond P. CanalePublisher:McGraw-Hill Education
 Introductory Mathematics for Engineering Applicat...Advanced MathISBN:9781118141809Author:Nathan KlingbeilPublisher:WILEY
 Mathematics For Machine TechnologyAdvanced MathISBN:9781337798310Author:Peterson, John.Publisher:Cengage Learning,


Advanced Engineering Mathematics
Advanced Math
ISBN:9780470458365
Author:Erwin Kreyszig
Publisher:Wiley, John & Sons, Incorporated

Numerical Methods for Engineers
Advanced Math
ISBN:9780073397924
Author:Steven C. Chapra Dr., Raymond P. Canale
Publisher:McGraw-Hill Education

Introductory Mathematics for Engineering Applicat...
Advanced Math
ISBN:9781118141809
Author:Nathan Klingbeil
Publisher:WILEY

Mathematics For Machine Technology
Advanced Math
ISBN:9781337798310
Author:Peterson, John.
Publisher:Cengage Learning,

