
MATLAB: An Introduction with Applications
6th Edition
ISBN: 9781119256830
Author: Amos Gilat
Publisher: John Wiley & Sons Inc
expand_more
expand_more
format_list_bulleted
Related questions
Question
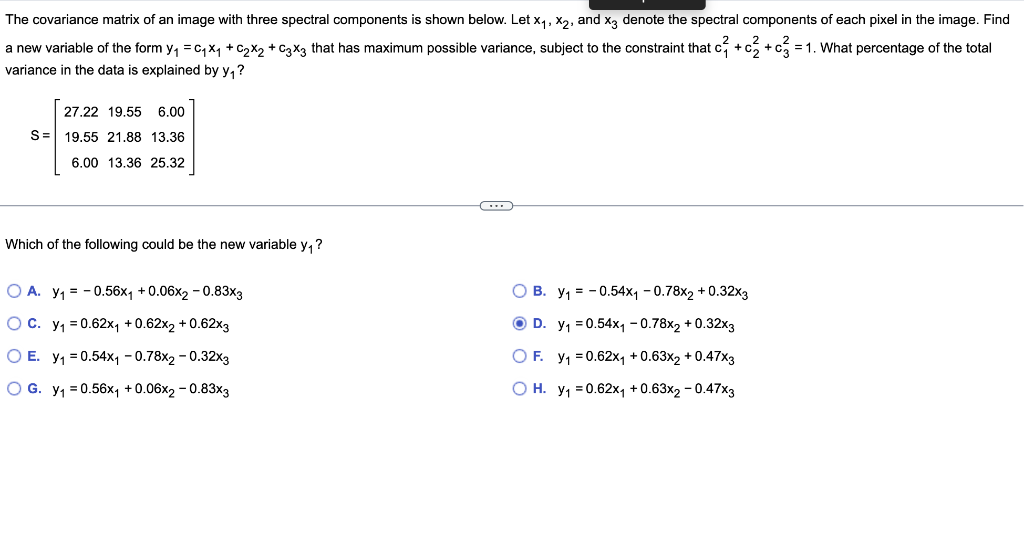

Transcribed Image Text:The covariance matrix of an image with three spectral components is shown below. Let x₁, x₂, and x3 denote the spectral components of each pixel in the image. Find
a new variable of the form y₁ = C₁X₁ + C₂X₂ + C3x3 that has maximum possible variance, subject to the constraint that c3 + c3 + c3 = 1. What percentage of the total
variance in the data is explained by y₁?
27.22 19.55 6.00
S= 19.55 21.88 13.36
6.00 13.36 25.32
(...)
Which of the following could be the new variable y₁?
O A. Y₁ = -0.56x₁ +0.06x2 -0.83x3
O C.
y₁ = 0.62x₁ +0.62x2 +0.62x3
O B. y₁ = -0.54x₁ -0.78x2 +0.32x3
ⒸD. y₁=0.54x₁1 -0.78x2 + 0.32x3
O F. y₁ = 0.62x₁ +0.63x2 +0.47x3
y₁ = 0.62x₁ +0.63x2 -0.47x3
O E. y₁=0.54x₁1 -0.78x2 -0.32x3
O G. y₁ = 0.56x₁ +0.06x2 -0.83x3
O H.
Expert Solution
This question has been solved!
Explore an expertly crafted, step-by-step solution for a thorough understanding of key concepts.

This is a popular solution

Trending nowThis is a popular solution!

Step by stepSolved in 2 steps

Knowledge Booster

Similar questions
- 1.The least squares estimate of β0 is i. 2.3176 ii. 0.7176 iii. 0.8824 iv. 1.8990 2. The least squares estimate of β1 is i. 0.4773 ii. 0.2990 iii. 0.2061 iv. 0.9265 3. The linear correlation coefficient r is i. 0.4122 ii. 0.1700 iii. 0.2990 iv. 0.5683arrow_forwardWhich of the following is true about the correlation coefficient? A) It ranges from 0 to 1. B) It indicates the strength and direction of a linear relationship between two variables. C) It can be greater than 1. D) It is used to measure the central tendency of data.arrow_forwardSuppose a local university researcher wants to build a linear model that predicts the freshman year GPA of incoming students based on high school SAT scores. The researcher randomly selects a sample of 40 sophomore students at the university and gathers their freshman year GPA data and the high school SAT score reported on each of their college applications. He produces a scatterplot with SAT scores on the horizontal axis and GPA on the vertical axis. The data has a linear correlation coefficient of 0.481202. Additional sample statistics are summarized in the table below. Variable Sample Sample standard Variable description mean deviation high school SAT score x = 1495.716802 Sx = 109.915203 y freshman year GPA y = 3.260911 Sy 0.492802 r = 0.481202 slope = 0.002157 Determine the y-intercept, a, of the least-squares regression line for this data. Give your answer precise to at least four decimal places. a =arrow_forward
- Psi is a measure of compressive strength, or the ability of the material to carry loads and handle compression. The desired concrete psi rating used for sidewalks and residential driveways ranges from 2500psi to 3000psi obtained from mixing cement, stone, and sand in different ratios but with the same amount of water. The summary of the psi's of three (3) such concrete mixes made by three (3) different civil engineering students is given as follows: Mean vector: The variance-covariance matrix: Concrete mix Mean Concrete mix 1 Concrete mix 2 Concrete mix 3 Concrete mix 1 | Concrete mix 2 2700 18 12 2 3000 12 16 3 2400 Concrete mix 3 16 25 Let the random variable Y be the vector of the psi's of concrete mixes obtained by the students, i.e. Y1, denotes the psi of concrete mix made by student 1, Y2 is the psi of concrete mix made by student 2 and Y3 is the psi of concrete mix psi made by student 3. (a) Find (i) the multivariate probability distribution function (pdf) of Y. (ii) the…arrow_forwardWhich scatterplot shows a nonlinear association?arrow_forwardConsider an AR(2) model: STEPS; -Write the equation of the AR(2) model- Determine the model based on the delay operator.- Find the expected value of the model- Find the variance of the model.- Find the covariances associated with 1,2, and s steps.- Find the associated correlation indices of 1,2, and s steps.- Assume that information is available up to time $h$ and the function that contains the accumulated information f(h, h-1,……), determine the forecasts and the error associated with 1,2, and s steps.- Assume that there is an initial value of the returns, denoted by $r_0$, and we have the AR(2) model at time rt, convert the AR(2) model into its equivalent MA(t)arrow_forward
- If a predictor variable (x) is highly correlated with another predictor variable (x), the variables are providing essentially the same information. This is best referred to as multi-collinearity. Group of answer choices True Falsearrow_forwardConsider an MA(2) model: STEPS -Write the equation of the M(2) model-Determine the model based on the delay operator.- Find the expected value of the model- Find the variance of the model.- Find the covariances associated with 1,2, and s steps.- Find the associated correlation indices of 1,2, and s steps.- Assume that information is available up to time $h$ and the function that contains the accumulated information f(h, h-1,……), determine the forecasts and the error associated with 1,2, and s steps.arrow_forwardGiven data points (1, 3), (0, -1). (2. 1). (4. 1). (-2. 1), center the data and compute the sample covariance matrix. Record the entries of the covariance matrix row by row, separated by commas.arrow_forward
arrow_back_ios
arrow_forward_ios
Recommended textbooks for you
- MATLAB: An Introduction with ApplicationsStatisticsISBN:9781119256830Author:Amos GilatPublisher:John Wiley & Sons Inc
 Probability and Statistics for Engineering and th...StatisticsISBN:9781305251809Author:Jay L. DevorePublisher:Cengage Learning
 Statistics for The Behavioral Sciences (MindTap C...StatisticsISBN:9781305504912Author:Frederick J Gravetter, Larry B. WallnauPublisher:Cengage Learning
  Elementary Statistics: Picturing the World (7th E...StatisticsISBN:9780134683416Author:Ron Larson, Betsy FarberPublisher:PEARSON
 The Basic Practice of StatisticsStatisticsISBN:9781319042578Author:David S. Moore, William I. Notz, Michael A. FlignerPublisher:W. H. Freeman
 Introduction to the Practice of StatisticsStatisticsISBN:9781319013387Author:David S. Moore, George P. McCabe, Bruce A. CraigPublisher:W. H. Freeman
MATLAB: An Introduction with Applications
Statistics
ISBN:9781119256830
Author:Amos Gilat
Publisher:John Wiley & Sons Inc
Probability and Statistics for Engineering and th...
Statistics
ISBN:9781305251809
Author:Jay L. Devore
Publisher:Cengage Learning
Statistics for The Behavioral Sciences (MindTap C...
Statistics
ISBN:9781305504912
Author:Frederick J Gravetter, Larry B. Wallnau
Publisher:Cengage Learning
Elementary Statistics: Picturing the World (7th E...
Statistics
ISBN:9780134683416
Author:Ron Larson, Betsy Farber
Publisher:PEARSON
The Basic Practice of Statistics
Statistics
ISBN:9781319042578
Author:David S. Moore, William I. Notz, Michael A. Fligner
Publisher:W. H. Freeman
Introduction to the Practice of Statistics
Statistics
ISBN:9781319013387
Author:David S. Moore, George P. McCabe, Bruce A. Craig
Publisher:W. H. Freeman