MATLAB: An Introduction with Applications
6th Edition
ISBN: 9781119256830
Author: Amos Gilat
Publisher: John Wiley & Sons Inc
expand_more
expand_more
format_list_bulleted
Concept explainers
Question
thumb_up100%
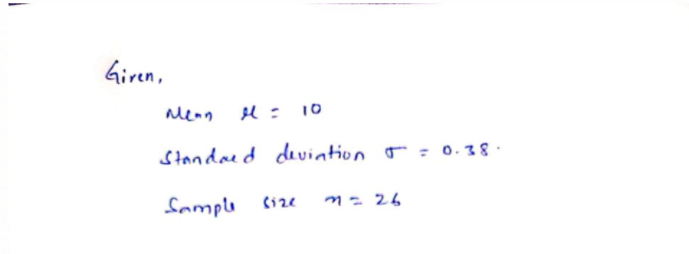
The contents of a soda can holds an approximate and
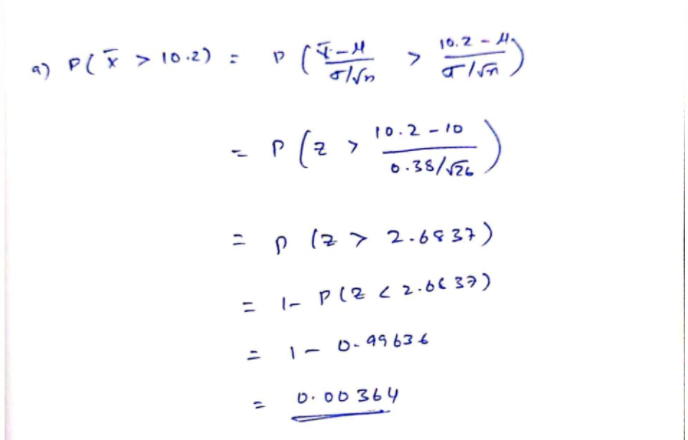
a) x̅ exceeds 10.2 oz.
b) x̅ is between 9.9 oz and 10.1 oz.
Expert Solution
arrow_forward
Step 1

arrow_forward
Step 2

Trending nowThis is a popular solution!
Step by stepSolved in 3 steps with 3 images

Knowledge Booster
Learn more about
Need a deep-dive on the concept behind this application? Look no further. Learn more about this topic, statistics and related others by exploring similar questions and additional content below.Similar questions
- Let X represent the full length of a certain species of newt. Assume that X has a normal probability distribution with mean 130.2 inches and standard deviation 3.2 inches. You intend to measure a random sample of n = 91 newts. The bell curve below represents the distibution of these sample means. The scale on the horizontal axis is the standard error of the sampling distribution. Complete the indicated boxes, correct to two decimal places.arrow_forwardThe compressive strength of samples of cement can be modeled by a normal distribution with a mean of 6000 kilograms per square centimeter and a standard deviation of 100 kilograms per square centimeter. What is the probability that the strength is smaller than 5900? a). 0.159 b). 0.841 c). 0.5 d). 0arrow_forwardLet X represent the full length of a certain species of newt. Assume that X has a normal probability distribution with mean 148.1 inches and standard deviation 5.6 inches. You intend to measure a random sample of n = 22 newts. The bell curve below represents the distibution of these sample means. The scale on the horizontal axis is the standard error of the sampling distribution. Complete the indicated boxes with the mean and two standard deviations in each direction, correct to two decimal places. ||arrow_forward
- Continuous distribution. Draw a bell shaped curve to show the x and z values and the probability asked for.Assume that the heights of male students are normally distributed with a mean of 70.a inches and a standard deviation of 2.a inches. a) Find the probability that male students have a height between the Toronto Maple Leaf’s average height of 72.4 in. and the Philadelphia Flyers’ average height of 74.6 in.arrow_forwardProvide an appropriate response. 5) Find the area of the shaded region. The graph depicts IQ scores of adults, and those scores 5) are normally distributed with a mean of 100 and a standard deviation of 15 (as on the Wechsler test). 60 65 70 75 80 85 90 95 100 105 110 115 120 125 130 135 140 Assume that X has a normal distribution, and find the indicated probability. 6) The mean is µ = 137.0 and the standard deviation is a = 5.3. Find the probability that X is between 134.4 and 140.1. 6) 1 7) 7) The mean is µ = 60.0 and the standard deviation is o = 4.0. Find the probability that X is less than 53.0. 8) 8) The weekly salaries of teachers in one state are normally distributed with a mean of $490 and a standard deviation of $45. What is the probability that a randomly selected teacher earns more than $525 a week?arrow_forwardLet X represent the full height of a certain species of tree. Assume that X has a normal probability distribution with μ = 248.8 ft and o = 5.1 ft. You intend to measure a random sample of n = a. What is the mean of the distribution of sample means? Hã ft = b. What is the standard deviation of the distribution of sample means (i.e., the standard error in estimating the mean)? 0x = 241 trees. P(x > 249) ft c. What is the probability that the average height of a random sample of 241 trees is larger than 249? Round answer to 4 decimal places. =arrow_forward
arrow_back_ios
arrow_forward_ios
Recommended textbooks for you
 MATLAB: An Introduction with ApplicationsStatisticsISBN:9781119256830Author:Amos GilatPublisher:John Wiley & Sons Inc
 Probability and Statistics for Engineering and th...StatisticsISBN:9781305251809Author:Jay L. DevorePublisher:Cengage Learning
 Statistics for The Behavioral Sciences (MindTap C...StatisticsISBN:9781305504912Author:Frederick J Gravetter, Larry B. WallnauPublisher:Cengage Learning
 Elementary Statistics: Picturing the World (7th E...StatisticsISBN:9780134683416Author:Ron Larson, Betsy FarberPublisher:PEARSON
 The Basic Practice of StatisticsStatisticsISBN:9781319042578Author:David S. Moore, William I. Notz, Michael A. FlignerPublisher:W. H. Freeman
 Introduction to the Practice of StatisticsStatisticsISBN:9781319013387Author:David S. Moore, George P. McCabe, Bruce A. CraigPublisher:W. H. Freeman

MATLAB: An Introduction with Applications
Statistics
ISBN:9781119256830
Author:Amos Gilat
Publisher:John Wiley & Sons Inc

Probability and Statistics for Engineering and th...
Statistics
ISBN:9781305251809
Author:Jay L. Devore
Publisher:Cengage Learning

Statistics for The Behavioral Sciences (MindTap C...
Statistics
ISBN:9781305504912
Author:Frederick J Gravetter, Larry B. Wallnau
Publisher:Cengage Learning

Elementary Statistics: Picturing the World (7th E...
Statistics
ISBN:9780134683416
Author:Ron Larson, Betsy Farber
Publisher:PEARSON

The Basic Practice of Statistics
Statistics
ISBN:9781319042578
Author:David S. Moore, William I. Notz, Michael A. Fligner
Publisher:W. H. Freeman

Introduction to the Practice of Statistics
Statistics
ISBN:9781319013387
Author:David S. Moore, George P. McCabe, Bruce A. Craig
Publisher:W. H. Freeman