
MATLAB: An Introduction with Applications
6th Edition
ISBN: 9781119256830
Author: Amos Gilat
Publisher: John Wiley & Sons Inc
expand_more
expand_more
format_list_bulleted
Related questions
Question
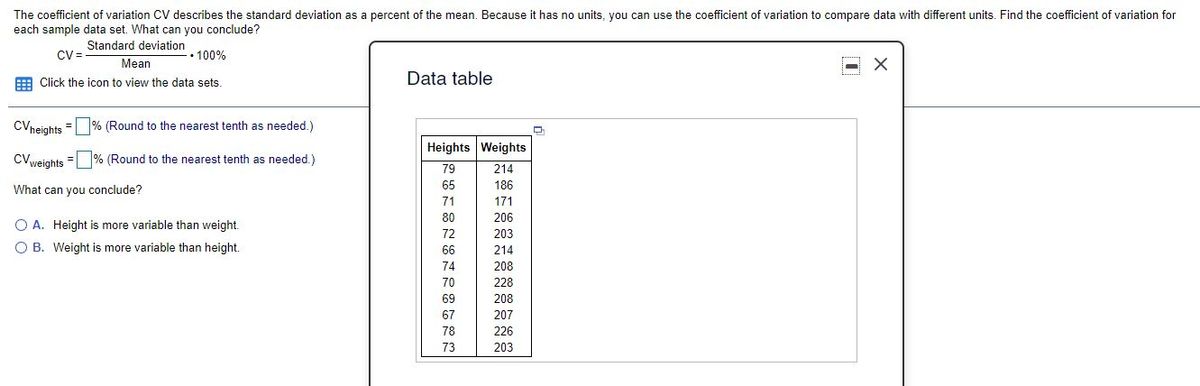

Transcribed Image Text:The coefficient of variation CV describes the standard deviation as a percent of the mean. Because it has no units, you can use the coefficient of variation to compare data with different units. Find the coefficient of variation for
each sample data set. What can you conclude?
Standard deviation
CV=
• 100%
Mean
E Click the icon to view the data sets
Data table
CVneights = % (Round to the nearest tenth as needed.)
Heights Weights
CVweights = % (Round to the nearest tenth as needed.)
79
214
65
186
What can you conclude?
71
171
80
206
O A. Height is more variable than weight.
72
203
O B. Weight is more variable than height.
66
214
74
208
70
228
69
208
67
207
78
226
73
203
Expert Solution
This question has been solved!
Explore an expertly crafted, step-by-step solution for a thorough understanding of key concepts.

This is a popular solution

Trending nowThis is a popular solution!

Step by stepSolved in 3 steps

Knowledge Booster

Similar questions
- Elght students were asked how many books they read last summer. Their answers are listed below. 8, 5, 7, 5, 7, 9, 5, 5 Find the range and the mode for the data. Range: Mode:arrow_forwardFor the special Thanksgiving edition of the local newspaper, a reporter wrote a heartwarming piece. In the piece there appeared figures on the number of turkey dinners served by various local charities. The histogram below summarizes the data. Use the histogram to answer each of the questions. Frequency (Number of charities) 10- 9. 8 7 5. 3 2 1 90 to 139 140 to 189 190 to 239 240 to 289 Number of turkey dinners (a) What is the class width? (b) According to the histogram, what is the total number of charities? (c) How many charities served from 190 to 239 turkey dinners? Oarrow_forwardUsing a normal curve table, give the percentage of scores between the mean and a Z score of (a) 0.72, (b) 0.82, (c) 1.46, (d) 1.56, (e) - 0.72. Click here to view page 1 of the table. Click here to view page 2 of the table. Click here to view page 3 of the table. Click here to view page 4 of the table.arrow_forward
- The ages (in years) and helghts (in inches) of all pitchers for a beseball team are listed. Find the coefficient of variation for each of the two data sets. Then compare the results. -Click the Icon to view the data sets. CV. %D Round to one decimal place as needed.)arrow_forwardData Table for Wins and Losses The accompanying table shows data for the number of wins and losses in the Major League for 2017. Complete parts a and b below. E Click the icon to view the data table. Team Wins (ESPN) Losses (ESPN) Arizona Diamondbacks 93 69 a. Find the percentile rank for the wins by the San Diego Padres. Atlanta Braves 72 90 Baltimore Orioles 75 87 The percentile rank for the wins by the San Diego Padres is. (Round to one decimal place as needed.) Boston Red Sox Chicago Cubs Chicago White Sox 93 69 92 70 b. Find the percentile rank for the losses by the Pittsburgh Pirates. 67 95 Cincinnati Reds 68 94 The percentile rank for the losses by the Pittsburgh Pirates is Cleveland Indians 102 60 (Round to one decimal place as needed.) Colorado Rockies 87 75 Detroit Tigers 64 98 Houston Astros 101 61 Kansas City Royals Los Angeles Angels Los Angeles Dodgers 80 82 80 82 104 58 Miami Marlins 77 85 Milwaukee Brewers 86 76 Minnesota Twins 85 77 New York Mets 70 92 New York Yankees…arrow_forwardWhat value corresponds to the 30th percentile?arrow_forward
- Find the mean, mode, and medianarrow_forwardDr. Seboo has collected the total cholesterol levels of all his patients. He is trying to figure what the typical cholesterol level falls. Use the following output to answer the questions. a. What variable was recorded in the data collected? Classify the variable as categorical or quantitative.Variable: ______________________ Circle one: Categorical or Quantitativeb. Describe the shape of the above distribution:c. The average cholesterol level was _______________, and 50% of this sample cholesterol levels was ________________ or more. The minimum cholesterol level was _______________, while the maximum number cholesterol level was _________________. The middle 50% of cholesterol levels in this sample were between ______________ and ______________. According to _____________________________ Rule, we expect ________% of the cholesterol levels to be between ________________ and _______________ (two standard deviations from the mean).d. Construct a 95% confidence interval for the mean…arrow_forwardA simple data set has been provided to practice the basics of finding measures of variation. 2, 4, 8, 8 For the data set, determine the range and the sample standard deviation.arrow_forward
- Earnings of Nonliving Celebrities Forbes magazine prints an annual Top-Earning Nonliving Celebrities list (based on royalties and estate earnings). Find the mean, median, mode, and midrange for the data. Comment on the skewness. Figures represent millions of dollars. Rodgers & Hammerstein 235 John Lennon 15 Michael Jackson 90 Dr. Seuss 15 Elvis Presley 55 Albert Einstein 10 JRR Tolkien 50 Michael Crichton 9. Charles Schulz 35 Jimi Hendrix 8 Send data to Excel Part: 0 / 5 Part 1 of 5 Find the mean. Rounding rule for the mean: round to one more decimal place than the data as needed. Mean:arrow_forwardThe scores and their percent of the final grade for a statistics student are given. What is the student's weighted mean score? The student's weighted mean score is. (Simplify your answer. Round to two decimal places as needed.) Homework Quiz Quiz Project Final Exam Score Percent of final grade 85 90 90 98 89 15 10 10 35 30arrow_forwardWe have provided simple data sets for you to practice the basics of finding a a. population mean. b. population standard deviation. 3, 5, 7arrow_forward
arrow_back_ios
SEE MORE QUESTIONS
arrow_forward_ios
Recommended textbooks for you
- MATLAB: An Introduction with ApplicationsStatisticsISBN:9781119256830Author:Amos GilatPublisher:John Wiley & Sons Inc
 Probability and Statistics for Engineering and th...StatisticsISBN:9781305251809Author:Jay L. DevorePublisher:Cengage Learning
 Statistics for The Behavioral Sciences (MindTap C...StatisticsISBN:9781305504912Author:Frederick J Gravetter, Larry B. WallnauPublisher:Cengage Learning
  Elementary Statistics: Picturing the World (7th E...StatisticsISBN:9780134683416Author:Ron Larson, Betsy FarberPublisher:PEARSON
 The Basic Practice of StatisticsStatisticsISBN:9781319042578Author:David S. Moore, William I. Notz, Michael A. FlignerPublisher:W. H. Freeman
 Introduction to the Practice of StatisticsStatisticsISBN:9781319013387Author:David S. Moore, George P. McCabe, Bruce A. CraigPublisher:W. H. Freeman
MATLAB: An Introduction with Applications
Statistics
ISBN:9781119256830
Author:Amos Gilat
Publisher:John Wiley & Sons Inc
Probability and Statistics for Engineering and th...
Statistics
ISBN:9781305251809
Author:Jay L. Devore
Publisher:Cengage Learning
Statistics for The Behavioral Sciences (MindTap C...
Statistics
ISBN:9781305504912
Author:Frederick J Gravetter, Larry B. Wallnau
Publisher:Cengage Learning
Elementary Statistics: Picturing the World (7th E...
Statistics
ISBN:9780134683416
Author:Ron Larson, Betsy Farber
Publisher:PEARSON
The Basic Practice of Statistics
Statistics
ISBN:9781319042578
Author:David S. Moore, William I. Notz, Michael A. Fligner
Publisher:W. H. Freeman
Introduction to the Practice of Statistics
Statistics
ISBN:9781319013387
Author:David S. Moore, George P. McCabe, Bruce A. Craig
Publisher:W. H. Freeman