MATLAB: An Introduction with Applications
6th Edition
ISBN: 9781119256830
Author: Amos Gilat
Publisher: John Wiley & Sons Inc
expand_more
expand_more
format_list_bulleted
Question

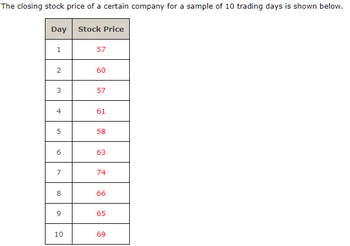
Transcribed Image Text:The closing stock price of a certain company for a sample of 10 trading days is shown below.
Day Stock Price
1
2
3
4
5
6
7
00
8
9
10
57
60
57
61
58
63
74
66
65
69

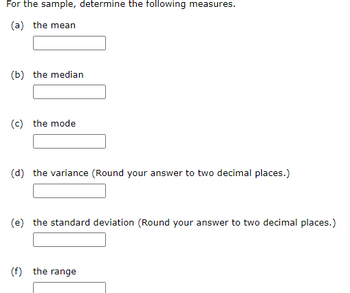
Transcribed Image Text:For the sample, determine the following measures.
(a) the mean
(b) the median
(c) the mode
(d) the variance (Round your answer to two decimal places.)
(e) the standard deviation (Round your answer to two decimal places.)
(f) the range
Expert Solution
This question has been solved!
Explore an expertly crafted, step-by-step solution for a thorough understanding of key concepts.
This is a popular solution
Trending nowThis is a popular solution!
Step by stepSolved in 2 steps with 2 images

Knowledge Booster
Similar questions
- The rate of return for the last 19 years of a certain segment of the stock market is given in the table. (The data is also provided below the table as a comma-separated list to make it easier to copy.) Market Segment Rate of Return, 2002-2020 Year Rate of Return (%) 2020 3.23 2019 6.14 2018 11.39 2017 15.99 2016 3.24 2015 -3.86 2014 -1.04 2013 8.49 2012 5.93 2011 6.96 2010 1.98 2009 3.13 2008 -6.55 2007 7.27 2006 3.02 2005 -1.34 2004 7.28 2003 6.27 2002 -0.76 Rate of Return (%): 3.23, 6.14, 11.39, 15.99, 3.24, -3.86, -1.04, 8.49, 5.93, 6.96, 1.98, 3.13, -6.55, 7.27, 3.02, -1.34, 7.28, 6.27, -0.76 Find the 34th percentile of the data. 6.46arrow_forwardFind the values at the 35th and 70th percentiles for the data set. 15 14 17 8 10 1 6 1 20 18 18 5 14 5 12 18 1 17 5 7arrow_forwardThe stem-and-leaf display below gives the test scores for the students in Prof. Ramirez's 10 a.m. and 11 10 a.m. class and 23 students in the 11 a.m. class. Use the display to answer the questions that follow. Test scores for Prof. Ramirez's economics classes 10 a.m. 11 a.m. 9 87 425 8632 589 7775551 06002489 9 854 7 4 55 679 78025578 95 Key: 47 + - 7|4 |2 42 (a) What were the ranges for the two classes? 10 a.m. 11 a.m. (b) Which class had the higher median score? o10 a.m. o11 a.m. OThe medians were the same (c) Which class had more scores in the 50s? 10 a.m. o11 a.m. OEach had the samearrow_forward
- The top ten medal-winning nations in a tournament in a particuarr year are shown in the table. Use the given information and calculate the median number of bronze medals for all nation. Nation Gold Silver Bronze Total A 14 14 11 39 B 14 10 7 31 C 11 8 10 29 D 9 8 6 23 E 8 6 5 22 F 5 8 4 17 G 2 6 8 16 H 5 6 4 15 I 5 4 6 15 J 7 6 0 13 The median number of bronze medal for all nations is ____ (Type an interger or a decimal. Round to the nearest tenth as needed.)arrow_forwardC8. According to the Pew Research Center (2015), recent immigrants are better educated than earlier immigrants to the United States. The change was attributed to the availability of better education in each region or country of origin. The percentage of immigrants 25 years of age and older who completed at least high school is reported in this table for 1970 to 2013. Write a statement describing the change over time in the percentage who completed at least a high school degree. 1970 1980 1990 2000 2013 Mexico 14 17 26 30 48 Other Central/South America 57 53 60 66 Asia 75 72 75 82 84 48 68 81 87 95 Europe 36 48 52 58 72 Caribbean 81 91 88 85 85 Africa Source: Pew Research Center, Modern Immigration Wave Brings 59 Million to U.S., Driving Population Growth and Change Through 2065, 2015. Retrieved from https://www.pewresearch.org/hispanic/2015/09/28/modern- immigration-wave-brings-59-million-to-u-s-driving-population-growth-and-change-through-2065/ 52arrow_forwardwhich is the correct answer?arrow_forward
- Student grades on a chemistry exam were: 77; 78; 71; 81; 89; 51; 79; 82; 84; 91 a. Select the stem-and-leaf plot of the data. Stem Leaf 5 6 7 8 9 5 6 7 Stem Leaf 8 51 9 77 78 71 79 81 89 82 84 91 1 1789 1249 1arrow_forwardThe table below gives the percent of U.S. seniors (aged 65+ years) who used the internet in selected years. Year 2012 2014 2016 2018 2019 % of U.S. seniors using internet 54 57 64 66 73 Use a line of best-fit to predict the percent of U.S. seniors who will use the internet in the year 2022. A. 74 % B.76 % C.77 % D.79 % E.81 %arrow_forwardFind the values at the 35th and 70th percentiles for the data set. 15 14 17 8 10 1 6 1 20 18 18 5 14 5 12 18 1 17 5 7arrow_forward
- 2 9 11 11 13 14 14 15 15 16 16 17 17 18 18 18 18 19 19 20 give the five-number summary. find the IQR, LF, UF, outliers, range, and mid-rangearrow_forwardA company's price/earnings (P/E) ratio is the company's current stock price divided by the latest 12 months' earnings per share. Suppose the following table shows the P/E ratios for a sample of 10 Japanese companies and 12 U.S. companies. Japan P/E Ratio 156 28 14 129 38 216 67 665 36 64 United States P/E Ratio 12 27 27 46 23 17 28 17 28 34 19 17 Is the difference between the P/E ratios for the two countries significant? Use the MWW test and ? = 0.01 to support your conclusion. State the null and alternative hypotheses. H0: The two populations of P/E ratios are identical.Ha: The two populations of P/E ratios are not identical.H0: The two populations of P/E ratios are not identical.Ha: The two populations of P/E ratios are identical. H0: Median for Japanese companies − Median for U.S. companies > 0Ha: Median for Japanese companies − Median for U.S. companies = 0H0: Median for Japanese companies − Median for U.S.…arrow_forwardA poll uses responses everal questions to calculate a "Happiness" index that measures overall happiness. An article included the happiness index for the 7 years between 2008 and 2016. Also included in the article were the percentages of people who responded "somewhat agree" or "strongly agree" to the following statements. Statement 1 (happy with life) 1: At this time, I'm generally happy with my life. Statement Year 2008 2009 2010 2011 2013 2015 2016 2 (won't benefit): I won't get much benefit from the things that I do anytime soon. Happiness Index 36 36 34 32 36 33 30 Happy with Life Statement (percentage somewhat or strongly agree) 82 83 78 79 83 80 82 Won't Benefit Statement (percentage somewhat or strongly agree) 31 37 35 39 39 37 42 (a) Calculate the value of the correlation coefficient for Happiness index and the response to the Happy with life statement. (Round your answer to four decimal places.) 0.8321 x (b) Calculate the value of the correlation coefficient for Happiness…arrow_forward
arrow_back_ios
SEE MORE QUESTIONS
arrow_forward_ios
Recommended textbooks for you
 MATLAB: An Introduction with ApplicationsStatisticsISBN:9781119256830Author:Amos GilatPublisher:John Wiley & Sons Inc
 Probability and Statistics for Engineering and th...StatisticsISBN:9781305251809Author:Jay L. DevorePublisher:Cengage Learning
 Statistics for The Behavioral Sciences (MindTap C...StatisticsISBN:9781305504912Author:Frederick J Gravetter, Larry B. WallnauPublisher:Cengage Learning
 Elementary Statistics: Picturing the World (7th E...StatisticsISBN:9780134683416Author:Ron Larson, Betsy FarberPublisher:PEARSON
 The Basic Practice of StatisticsStatisticsISBN:9781319042578Author:David S. Moore, William I. Notz, Michael A. FlignerPublisher:W. H. Freeman
 Introduction to the Practice of StatisticsStatisticsISBN:9781319013387Author:David S. Moore, George P. McCabe, Bruce A. CraigPublisher:W. H. Freeman

MATLAB: An Introduction with Applications
Statistics
ISBN:9781119256830
Author:Amos Gilat
Publisher:John Wiley & Sons Inc

Probability and Statistics for Engineering and th...
Statistics
ISBN:9781305251809
Author:Jay L. Devore
Publisher:Cengage Learning

Statistics for The Behavioral Sciences (MindTap C...
Statistics
ISBN:9781305504912
Author:Frederick J Gravetter, Larry B. Wallnau
Publisher:Cengage Learning

Elementary Statistics: Picturing the World (7th E...
Statistics
ISBN:9780134683416
Author:Ron Larson, Betsy Farber
Publisher:PEARSON

The Basic Practice of Statistics
Statistics
ISBN:9781319042578
Author:David S. Moore, William I. Notz, Michael A. Fligner
Publisher:W. H. Freeman

Introduction to the Practice of Statistics
Statistics
ISBN:9781319013387
Author:David S. Moore, George P. McCabe, Bruce A. Craig
Publisher:W. H. Freeman