MATLAB: An Introduction with Applications
6th Edition
ISBN: 9781119256830
Author: Amos Gilat
Publisher: John Wiley & Sons Inc
expand_more
expand_more
format_list_bulleted
Question

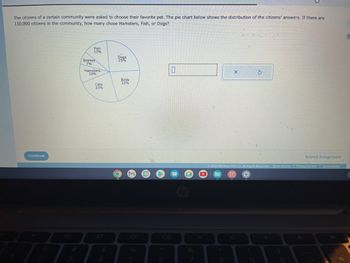
Transcribed Image Text:The citizens of a certain community were asked to choose their favorite pet. The pie chart below shows the distribution of the citizens' answers. If there are
110,000 citizens in the community, how many chose Hamsters, Fish, or Dogs?
Continue
Fish
13%
Snakes
7%
Hamsters
10%
Cats
23%
$
Dogs
25%
C
Birds
22%
M
5
0
&
*
X
8
5
Ⓒ2022 McGraw Hill LLC. All Rights Reserved. Terms of Use Privacy Center Accessibility
Submit Assignment
E
Expert Solution
This question has been solved!
Explore an expertly crafted, step-by-step solution for a thorough understanding of key concepts.
This is a popular solution
Trending nowThis is a popular solution!
Step by stepSolved in 2 steps

Knowledge Booster
Similar questions
- Ted identified the top five receivers available in the game by the number of receiving yards. Player Yards Calvin Johnson 1964 Andre Johnson 1598 Brandon Marshall 1508 Demaryius Thomas 1434 Vincent Jackson 1384 Select the suspected outliers in receiving yards from the available receivers in the game.arrow_forwardHere are ratings (on a scale from 1 through 5) for various Super Bowl party foods. You have to decide which food is rated highest (5 is a winner and 1 a loser). Decide what type of average you will use and why.arrow_forwardWhich of the following choices is the best price? a. $4.95 for 30 b. $1.95 for a dozen. c. $2.95 for 18arrow_forward
- The pie chart below shows percentages of grades of 700 students. A. 23% B. 27% C.33% D. 17%How many students have a grade of A?arrow_forwardA coach gave her team a test on sit-ups completed in one minute. Using the data collected, the coach constructed the following frequency distribution: Scores 90-99 80-89 70-79 60-69 50-59 40-49 30-39 20-29 10-19 0-9 1 4 9 21227 13 10 3 1 101 schem 2.0 and niniw elled beimcheq pritzen 19wol oarrow_forwardThe dotplot shows the distribution of passing rates for the bar exam at 185 law schools in the United States in a certain year. The five number summary is 27, 77, 87, 91, 99. Draw the boxplot and explain how you determined where the whiskers go. Click the icon to view.a dotplot of bar exam passing rates. Draw the boxplot. Select the correct answer below. OA. 0 100 Bar-Pass Rate (%) OB. Q G 100 Bar-Pass Rate (%) 0 Bar-Pass Rate (%) 100 O D. Q Q Q G 0 100 Bar-Pass Rate (%) Explain how you determined where the whiskers go. Select the correct answer below and fill in the answer boxes to complete your choice. (Type integers or decimals. Do not round.) OA. The whiskers extend to the minimum, and the maximum, OB. The whiskers identify the range of values that Q1 and Q3 will likely be found in for a given number of trials. The whiskers extend to the smallest expected value of Q1, expected value of Q3, OC. The whiskers extend to the most extreme values that are not potential outliers. The left…arrow_forward
- 63 students have an iPhone, 28 have android phones, and 22 have no cell phone. What percent of students have an iPhone? Round your answer to the nearest percent.arrow_forwardA school newspaper reporter decides to randomly survey 17 students to see if they will attend Tet (Vietnamese New Year) festivities this year. Based on past years, she knows that 11% of students attend Tet festivities. We are interested in the number of students who will attend the festivities. How many of the 17 students do we expect to attend the festivities?arrow_forwardFill in the remaining entries in the two-way table shown to the right. A survey of 140 patrons at a restaurant gave the preferences for entrees and drinks shown to the right. Fill in the missing entries in the table. Vegetarian Meat/Fish 51 Wine No Wine Total 38 Total 66 140arrow_forward
arrow_back_ios
arrow_forward_ios
Recommended textbooks for you
 MATLAB: An Introduction with ApplicationsStatisticsISBN:9781119256830Author:Amos GilatPublisher:John Wiley & Sons Inc
 Probability and Statistics for Engineering and th...StatisticsISBN:9781305251809Author:Jay L. DevorePublisher:Cengage Learning
 Statistics for The Behavioral Sciences (MindTap C...StatisticsISBN:9781305504912Author:Frederick J Gravetter, Larry B. WallnauPublisher:Cengage Learning
 Elementary Statistics: Picturing the World (7th E...StatisticsISBN:9780134683416Author:Ron Larson, Betsy FarberPublisher:PEARSON
 The Basic Practice of StatisticsStatisticsISBN:9781319042578Author:David S. Moore, William I. Notz, Michael A. FlignerPublisher:W. H. Freeman
 Introduction to the Practice of StatisticsStatisticsISBN:9781319013387Author:David S. Moore, George P. McCabe, Bruce A. CraigPublisher:W. H. Freeman

MATLAB: An Introduction with Applications
Statistics
ISBN:9781119256830
Author:Amos Gilat
Publisher:John Wiley & Sons Inc

Probability and Statistics for Engineering and th...
Statistics
ISBN:9781305251809
Author:Jay L. Devore
Publisher:Cengage Learning

Statistics for The Behavioral Sciences (MindTap C...
Statistics
ISBN:9781305504912
Author:Frederick J Gravetter, Larry B. Wallnau
Publisher:Cengage Learning

Elementary Statistics: Picturing the World (7th E...
Statistics
ISBN:9780134683416
Author:Ron Larson, Betsy Farber
Publisher:PEARSON

The Basic Practice of Statistics
Statistics
ISBN:9781319042578
Author:David S. Moore, William I. Notz, Michael A. Fligner
Publisher:W. H. Freeman

Introduction to the Practice of Statistics
Statistics
ISBN:9781319013387
Author:David S. Moore, George P. McCabe, Bruce A. Craig
Publisher:W. H. Freeman