
Practical Management Science
6th Edition
ISBN: 9781337406659
Author: WINSTON, Wayne L.
Publisher: Cengage,
expand_more
expand_more
format_list_bulleted
Related questions
Question
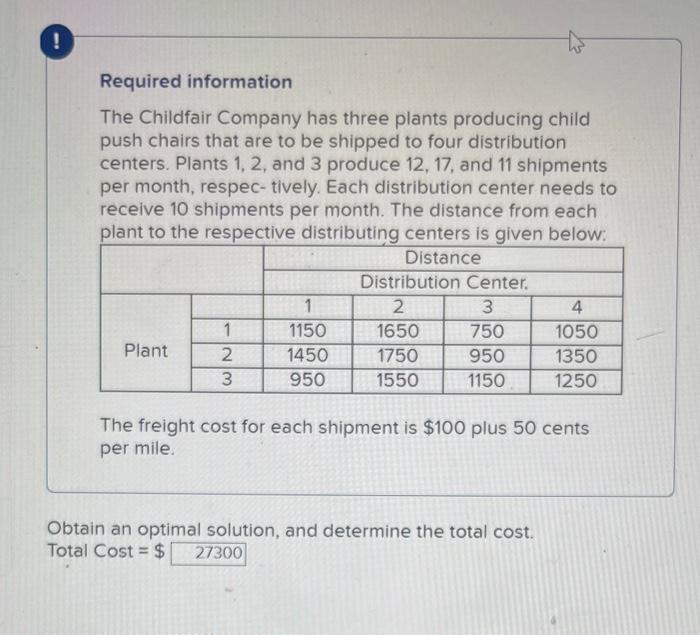

Transcribed Image Text:!
Required information
The Childfair Company has three plants producing child
push chairs that are to be shipped to four distribution
centers. Plants 1, 2, and 3 produce 12, 17, and 11 shipments
per month, respec- tively. Each distribution center needs to
receive 10 shipments per month. The distance from each
plant to the respective distributing centers is given below:
Distance
Plant
1
2
3
1
1150
1450
950
Distribution Center.
2
3
1650
750
1750
950
1550
1150
4
1050
1350
1250
The freight cost for each shipment is $100 plus 50 cents
per mile.
Obtain an optimal solution, and determine the total cost.
Total Cost = $ 27300
Expert Solution
This question has been solved!
Explore an expertly crafted, step-by-step solution for a thorough understanding of key concepts.

This is a popular solution

Trending nowThis is a popular solution!

Step by stepSolved in 2 steps with 3 images

Knowledge Booster

Similar questions
- Given the following network, with the indicated flow capacities of each branch, determine the maximum flow from source node 1 to destination node 6 and the flow along each branch:arrow_forwardPro-Carpet company manufactures carpets in Northwest Indiana and delivers them to warehouses and retail outlets. The network diagram is given in the figure below shows the possible routes and distances from the carpet plant in Valparaiso to the various warehouses or retail outlets. 12 11 13 Hi 6 15 20 10 M Наarrow_forwardDavis Inc. produces three product lines in its manufacturing facility in St. John's, NL: Product Line (1), Product Line (2), Product Line (3). Davis is considering dropping Product Line (2) because it has been unprofitable for the past two years. Which of the following items is (are) irrelevant to Davis' decision to drop/keep Product Line (2)? O a) Total cost of rent on the manufacturing facility. O b) Customer demand for Product Line (2). Oc) Savings in direct materials cost associated with Product Line (2). O d) All of the above items are considered relevant in the decision.arrow_forward
- (1) Find an optimal assignment of trucks to routes to minimize the total cost (using the Hungarian Method). B C 6 12 15 10 11 7 16 9 Truck / Route 1 2 3 4 Step la: Row subtraction (show your steps, e.g., see cell 1A) Truck / Route B 1 2 3 4 A 10 11 9 14 Step 1b: Column subtraction. Truck / Route 1 2 3 4 A 10-6=4 = = = = = B = с = C Step 2: Testing for optimal solution (show your lines covering the zero entries). What is the minimum number of lines required to cover all zeros? D 8 14 10 13 D = = D =arrow_forwardSean Willems has evaluated the vendors in Table S11.3 as well as F ricker V-Tech, the vendor in Problem( Referring to Problem S 11.1 2, Sean Willems, in additionto the two possible vendors evaluated in Table S11.3,has found a third possible vendor. He now wants to evaluate all three vendors using the weights in Table S 11 .3. He scores the third vendor, Fricker V-Tech, Ltd., as: Engineering Competence5, Process Capabili ty 5, Cost I, Quality 5, Performance to Schedule 4, and After-Sales Service I . Which vendor has the highest score? ),but the Quality Control Manager says that new da ta suggest thatSiemsen Systems, Inc.'s quality has deteriorated, a nd Siemsen should now score a 2 in the Quality category. Which of the three vendors now has the highest score?arrow_forwardlike this fill the boxesarrow_forward
- Required information The Childfair Company has three plants producing child push chairs that are to be shipped to four distribution centers. Plants 1, 2, and 3 produce 12, 17, and 11 shipments per month, respec- tively. Each distribution center heeds to receive 10 shipments per month. The distance from each plant to the respective distributing centers is given below: Distance Plant 1 2 3 1 1450 1750 1250 Distribution Center 3 1050 1250 1450 Obtain an optimal solution, and determine the total cost. Total Cost = $ 2 1950 2050 1850 The freight cost for each shipment is $100 plus 50 cents per mile. 4 1350 1650 1550arrow_forwardCargo Loading. You are in charge of loading cargo ships for International Cargo Company (ICC) at a major East Coast port. You have been asked to prepare a loading plan for an ICC freighter bound for Africa. An agricultural commodities dealer would like to transport the following products aboard this ship:Commodity Tons Available Volume per Ton (cu.ft.) Profit per Ton ($)1 4,000 40 702 3,000 25 503 2,000 60 604 1,000 50 80You can elect to load any or all of the available commodities. However, the ship has three cargo holds with the following capacity restrictions: Cargo Hold Weight Capacity (tons) Volume Capacity (cu.ft.)Forward 3,000 100,000Center 5,000 150,000Rear 2,000 120,000More than one type of commodity can be placed in the same cargo hold. However, because of balance considerations, the weight in the forward cargo hold must be within 10 percent of the weight in the rear cargo hold, and the center cargo hold…arrow_forward2arrow_forward
- 1.10 Adirondack Paper Mills, Inc. operates paper plants in Augusta, Maine, and Tupper Lake, New York. Warehouse facilities are located in Albany, New York, and Portsmouth, New Hampshire. Distributors are located in Boston, New York, and Philadelphia. The Augusta plant has a capacity of 300 units, and the Tupper Lake plant has a capacity of 100 units. Boston has a demand of 150 units, New York has a demand of 100 units, and Philadelphia has a demand of 150 units. The unit transportation costs (in dollars) for shipments from the two plants to the two warehouses are presented in Table 4 and those from the two warehouses to the three distributors are presented in Table 5. Draw the network representation of the Adirondack Paper Mills problem. Formulate the Adirondack Paper Mills problem as a linear programming problem. Solve the linear program to determine the minimum cost shipping schedule for the problem.arrow_forwardMacon Controls produces three different types of control units used to protect industrial equipment from overheating. Each of these units must be processed by a machine that Macon considers to be their process bottleneck. The plant operates on two 8-hour shifts, 5 days per week, 52 weeks per year. The table below provides the time standards at the bottleneck, lot sizes, and demand forecasts for the three units. Because of demand uncertainties, the operations manager obtained three demand forecasts (pessimistic, expected, and optimistic). The manager believes that a 25 percent capacity cushion is best. D Demand Forecast Component A B C Time Standard Processing Setup (hr/unit) (hr/lot) 0.04 1.0 0.20 4.4 0.05 8.5 Lot Size (units/lot) 50 75 100 Demand Forecast Pessimistic Expected Optimistic Pessimistic 16,000 10,000 18,000 a. How many machines are required to meet minimum (Pessimistic) demand, expected demand, and maximum (Optimistic) demand? (Enter your responses rounded up to the next…arrow_forwardHere is the initial tableau (by the NorthWest method) of a Min transportation problem. 1 2 3 Demand 19 Dual(v) 1 15 9 S1: 11 10 14 0 S2: 0 S3: B 0 B 3 N 15 Demanders 2 8 0 9 12 188 15 9 21 5 N 0 B 0 B 13 10 8 8 20 3 0 20 -4 N -6 N 0 B 17 7 5 4 0 0 1 -14 N -8 N 0 B Supply Dual(u) 0 (188 188 188 188 Using the Loop method fill in the values of the next tableau Each 2x2 matrix is the relevant square in the tableau. 9 (For grading convenience, in bottom right corner of each box use 1 for "B" and 0 for "N") 22 188 188 188 30 -4 2arrow_forward
arrow_back_ios
SEE MORE QUESTIONS
arrow_forward_ios
Recommended textbooks for you
- Practical Management ScienceOperations ManagementISBN:9781337406659Author:WINSTON, Wayne L.Publisher:Cengage,
 Operations ManagementOperations ManagementISBN:9781259667473Author:William J StevensonPublisher:McGraw-Hill Education
 Operations and Supply Chain Management (Mcgraw-hi...Operations ManagementISBN:9781259666100Author:F. Robert Jacobs, Richard B ChasePublisher:McGraw-Hill Education
 Purchasing and Supply Chain ManagementOperations ManagementISBN:9781285869681Author:Robert M. Monczka, Robert B. Handfield, Larry C. Giunipero, James L. PattersonPublisher:Cengage Learning
 Production and Operations Analysis, Seventh Editi...Operations ManagementISBN:9781478623069Author:Steven Nahmias, Tava Lennon OlsenPublisher:Waveland Press, Inc.
Practical Management Science
Operations Management
ISBN:9781337406659
Author:WINSTON, Wayne L.
Publisher:Cengage,
Operations Management
Operations Management
ISBN:9781259667473
Author:William J Stevenson
Publisher:McGraw-Hill Education
Operations and Supply Chain Management (Mcgraw-hi...
Operations Management
ISBN:9781259666100
Author:F. Robert Jacobs, Richard B Chase
Publisher:McGraw-Hill Education
Purchasing and Supply Chain Management
Operations Management
ISBN:9781285869681
Author:Robert M. Monczka, Robert B. Handfield, Larry C. Giunipero, James L. Patterson
Publisher:Cengage Learning
Production and Operations Analysis, Seventh Editi...
Operations Management
ISBN:9781478623069
Author:Steven Nahmias, Tava Lennon Olsen
Publisher:Waveland Press, Inc.