MATLAB: An Introduction with Applications
6th Edition
ISBN: 9781119256830
Author: Amos Gilat
Publisher: John Wiley & Sons Inc
expand_more
expand_more
format_list_bulleted
Question
Please answer these on a google sheet.

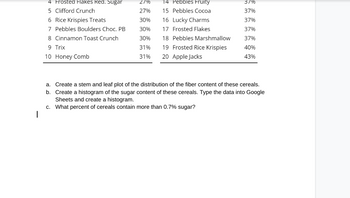
Transcribed Image Text:4 Frosted Flakes Red. Sugar
5 Clifford Crunch
6 Rice Krispies Treats
7 Pebbles Boulders Choc. PB
8 Cinnamon Toast Crunch
9 Trix
10 Honey Comb
2/%
27%
30%
30%
30%
31%
31%
14 Pebbles Fruity
15 Pebbles Cocoa
3/%
37%
37%
37%
18 Pebbles Marshmallow
37%
19 Frosted Rice Krispies 40%
20 Apple Jacks
43%
16 Lucky Charms
17 Frosted Flakes
a. Create a stem and leaf plot of the distribution of the fiber content of these cereals.
Create a histogram of the sugar content of these cereals. Type the data into Google
Sheets and create a histogram.
b.
c. What percent of cereals contain more than 0.7% sugar?
1

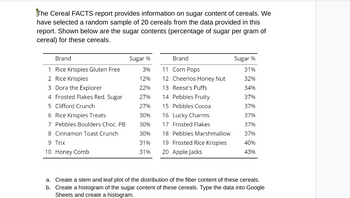
Transcribed Image Text:The Cereal FACTS report provides information on sugar content of cereals. We
have selected a random sample of 20 cereals from the data provided in this
report. Shown below are the sugar contents (percentage of sugar per gram of
cereal) for these cereals.
Brand
1 Rice Krispies Gluten Free
2 Rice Krispies
3 Dora the Explorer
4 Frosted Flakes Red. Sugar
5 Clifford Crunch
6 Rice Krispies Treats
7 Pebbles Boulders Choc. PB
8 Cinnamon Toast Crunch
9 Trix
10 Honey Comb
Sugar %
3%
12%
22%
27%
27%
30%
30%
30%
31%
31%
Brand
11 Corn Pops
12 Cheerios Honey Nut
13 Reese's Puffs
14 Pebbles Fruity
15 Pebbles Cocoa
16 Lucky Charms
17 Frosted Flakes
18 Pebbles Marshmallow
19 Frosted Rice Krispies
20 Apple Jacks
Sugar %
31%
32%
34%
37%
37%
37%
37%
37%
40%
43%
a. Create a stem and leaf plot of the distribution of the fiber content of these cereals.
b. Create a histogram of the sugar content of these cereals. Type the data into Google
Sheets and create a histogram.
Expert Solution
arrow_forward
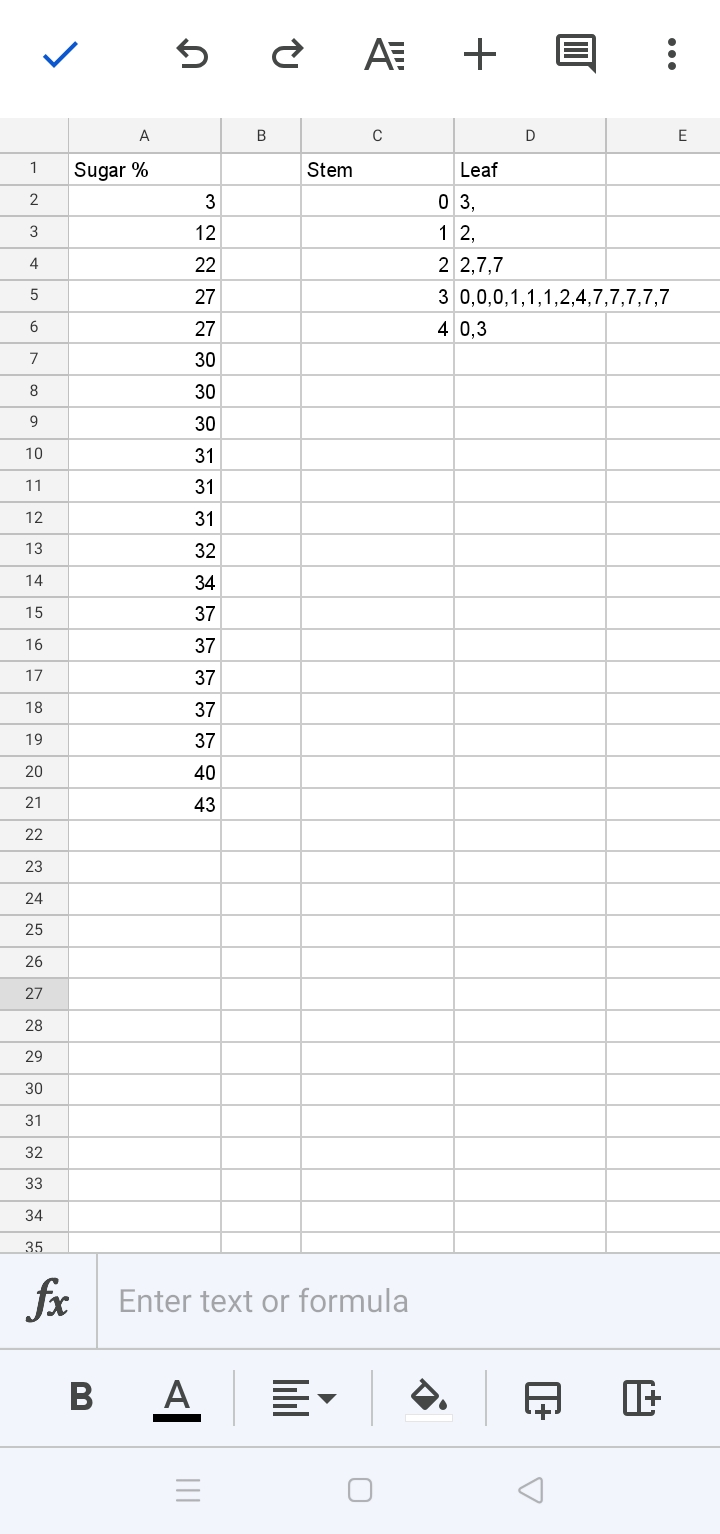
Step 1:- (a)
To create stem and leaf plot, we represent the left term as stem and right term as leaf.

Step by stepSolved in 3 steps with 3 images

Knowledge Booster
Similar questions
- Please provide correct answers. i ned help asap. please provide a clear table.arrow_forwardcalculatearrow_forwardA 3rd year student has 75 credits and a cumulative GPA of 2.88. This semester she is registered for 15 credits and hopes to raise his cumulative GPA to 3.00 and make the Dean’s List. Is it possible? What semester GPA will she need to accomplish that? Show your calculations or post a screenshot from your online GPA grade calculator.arrow_forward
arrow_back_ios
arrow_forward_ios
Recommended textbooks for you
 MATLAB: An Introduction with ApplicationsStatisticsISBN:9781119256830Author:Amos GilatPublisher:John Wiley & Sons Inc
 Probability and Statistics for Engineering and th...StatisticsISBN:9781305251809Author:Jay L. DevorePublisher:Cengage Learning
 Statistics for The Behavioral Sciences (MindTap C...StatisticsISBN:9781305504912Author:Frederick J Gravetter, Larry B. WallnauPublisher:Cengage Learning
 Elementary Statistics: Picturing the World (7th E...StatisticsISBN:9780134683416Author:Ron Larson, Betsy FarberPublisher:PEARSON
 The Basic Practice of StatisticsStatisticsISBN:9781319042578Author:David S. Moore, William I. Notz, Michael A. FlignerPublisher:W. H. Freeman
 Introduction to the Practice of StatisticsStatisticsISBN:9781319013387Author:David S. Moore, George P. McCabe, Bruce A. CraigPublisher:W. H. Freeman

MATLAB: An Introduction with Applications
Statistics
ISBN:9781119256830
Author:Amos Gilat
Publisher:John Wiley & Sons Inc

Probability and Statistics for Engineering and th...
Statistics
ISBN:9781305251809
Author:Jay L. Devore
Publisher:Cengage Learning

Statistics for The Behavioral Sciences (MindTap C...
Statistics
ISBN:9781305504912
Author:Frederick J Gravetter, Larry B. Wallnau
Publisher:Cengage Learning

Elementary Statistics: Picturing the World (7th E...
Statistics
ISBN:9780134683416
Author:Ron Larson, Betsy Farber
Publisher:PEARSON

The Basic Practice of Statistics
Statistics
ISBN:9781319042578
Author:David S. Moore, William I. Notz, Michael A. Fligner
Publisher:W. H. Freeman

Introduction to the Practice of Statistics
Statistics
ISBN:9781319013387
Author:David S. Moore, George P. McCabe, Bruce A. Craig
Publisher:W. H. Freeman