
MATLAB: An Introduction with Applications
6th Edition
ISBN: 9781119256830
Author: Amos Gilat
Publisher: John Wiley & Sons Inc
expand_more
expand_more
format_list_bulleted
Related questions
Question
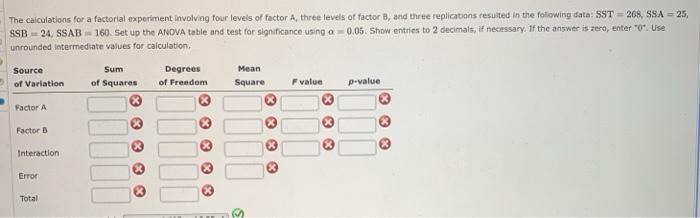

Transcribed Image Text:The caiculations for a factorial experiment involving four levels of factor A, three levels of factor B, and three replications resulted in the folowing data: SST= 268, SSA = 25,
SSB = 24, SSAB - 160. Set up the ANOVA table and test for significance using a- 0.05. Show entries to 2 decimals, if necessary. If the answer is zero, enter "0". Use
unrounded intermediate values for calculation.
Source
Sum
Degrees
Mean
of Varlation
of Squares
of Freedom
Square
Fvalue
p-value
Factor A
Factor B
Interaction
Error
Total
Expert Solution
This question has been solved!
Explore an expertly crafted, step-by-step solution for a thorough understanding of key concepts.

This is a popular solution

Trending nowThis is a popular solution!

Step by stepSolved in 2 steps with 1 images

Knowledge Booster


Learn more about
Need a deep-dive on the concept behind this application? Look no further. Learn more about this topic, statistics and related others by exploring similar questions and additional content below.Similar questions
- A researcher computes the following one-way within-subjects ANOVA table. Fill in the blanks for the appropriate cells in the table below. Source of Variation SS df MS FObt Between groups 10 Between persons 60 9 Within groups (error) 9 6 Total 124 19arrow_forwardA psychologist would like to know whether the season (autumn, winter, spring, and summer) has arny consistent effecat on people's sexual activity. In the middle of each sason, a psychologist selects a random sample of n = 26 studerts. Cach individual is given a sexual activity questionnaire. A one-factor ANOVA was used to analyze these data. Complete the following, ANOVA summary lable (a = 0.05). Round values for SS and MS to 3 decimal places as needed. Round p-value to 4 decimal places. Source ss df MS IP Between Within 1394 TOTAL With the given significance level, what is the decision regarding the hypotheses? Oreject the null hypothesis Ofail to reject the null hypothesis What would you canclude about these treatments? OThere is a meaningful difference between treatments. Thus, at least one mean is different. O These data do not provide meaningful evidence of a difference between the treatments. Thus, continue to assume all means are the same.arrow_forwardA Doctor is interested in the proportion of Lyon county residents who were infected with covid-19 virus. There were 425 covid-19 cases reported among 25474 residents in Lyon county a.What is the experimental unit in this experiment? b.What is the population in this experiment? c. What is a parameters considered in this experiment? d. What is a statistics in this experiment? e. What variables should pollster collect in this experiment?arrow_forward
- Table 1 summarizes the demographic and baseline data. Since two independent groups were included, the baseline data between these two groups were compared and p values were included in this table. Please tell which specific statistical test was used for the comparison between number of intubation attempts and trauma. Your answer should be as specific as possible. For example, was the test two-sided or one-sided? Was the test for paired samples or not?arrow_forwardIf SSBetween = 225.31 and there are four groups in the study with 10 cases per group, MSBetween = :arrow_forwardThe calculations for a factorial experiment involving four levels of factor A, three levels of factor B, and three replications resulted in the following data: SST=277 , SSA=25 , SSB=22 , SSAB=175 . Set up the ANOVA table and test for significance using a.05 . Show entries to 2 decimals, if necessary. If the answer is zero enter “0”. Source of Variation Sum of Squares Degrees of Freedom Mean Square F p-value Factor A Factor B Interaction Error Totalarrow_forward
- You conduct a one-factor ANOVA with 6 groups and 10 subjects in each group (a balanced design) and obtain F 2.07. Use Excel to find the requested values (report p-value accurate to 4 decimal places). betwee dfwithin p =arrow_forwardThe calculations for a factorial experiment involving four levels of factor A, three levels of factor B, and three replications resulted in the following data: SST = 263, SSA = 23, SSB = 22, SSAB = 160. Set up the ANOVA table and test for significance using a = 0.05. Show entries to 2 decimals, if necessary. If the answer is zero, enter "0". Use unrounded intermediate values for calculation. Source of Variation Factor A Factor B Interaction Error Total Sum of Squares 00000 The p-value for Factor A is Degrees of Freedom 00000 - Select your answer - What is your conclusion with respect to Factor A? + - Select your answer - The p-value for Factor B is - Select your answer - What is your conclusion with respect to Factor B? ◆ - Select your answer - The p-value for the interaction of factors A and B is ◆ ◆ Mean Square 0000 - Select your answer - What is your conclusion with respect to the interaction of Factors A and B? Select your answer - + F value ◆ p-valuearrow_forwardA study was conducted to investigate whether there are regional differences in peanut butter preference in the United States. The country was divided into 7 geographic regions, and in each region a random sample of peanut butter eaters were asked whether they preferred creamy or crunchy peanut butter. The responses were summarized in a 7-by-2 table of counts for each combination of geographic region and creamy or crunchy peanut butter preference. A A two-sample z-test for a difference between proportions B A chi-square test of homogeneity C A chi-square test of independence D A chi-square goodness-of-fit testarrow_forward
- Suppose you are comparing seven groups in an ANOVA, and your result is significant. You want to perform multiple comparison tests to determine which means differ from each other. Using Bonferroni's adjustment, what value of ape would you use for each pairwise comparison, if afw = 0.1? Round your answer to four decimal places. apc =arrow_forwardYou conduct a one-factor ANOVA with 6 groups and 5 subjecis in each group (a balanced design) and obtain F = 2.48. Use Excel to find the requested values (report accurate Lo 4 decimal places). dfiuiwmn = dfanhin = P=arrow_forward
arrow_back_ios
arrow_forward_ios
Recommended textbooks for you
- MATLAB: An Introduction with ApplicationsStatisticsISBN:9781119256830Author:Amos GilatPublisher:John Wiley & Sons Inc
 Probability and Statistics for Engineering and th...StatisticsISBN:9781305251809Author:Jay L. DevorePublisher:Cengage Learning
 Statistics for The Behavioral Sciences (MindTap C...StatisticsISBN:9781305504912Author:Frederick J Gravetter, Larry B. WallnauPublisher:Cengage Learning
  Elementary Statistics: Picturing the World (7th E...StatisticsISBN:9780134683416Author:Ron Larson, Betsy FarberPublisher:PEARSON
 The Basic Practice of StatisticsStatisticsISBN:9781319042578Author:David S. Moore, William I. Notz, Michael A. FlignerPublisher:W. H. Freeman
 Introduction to the Practice of StatisticsStatisticsISBN:9781319013387Author:David S. Moore, George P. McCabe, Bruce A. CraigPublisher:W. H. Freeman
MATLAB: An Introduction with Applications
Statistics
ISBN:9781119256830
Author:Amos Gilat
Publisher:John Wiley & Sons Inc
Probability and Statistics for Engineering and th...
Statistics
ISBN:9781305251809
Author:Jay L. Devore
Publisher:Cengage Learning
Statistics for The Behavioral Sciences (MindTap C...
Statistics
ISBN:9781305504912
Author:Frederick J Gravetter, Larry B. Wallnau
Publisher:Cengage Learning
Elementary Statistics: Picturing the World (7th E...
Statistics
ISBN:9780134683416
Author:Ron Larson, Betsy Farber
Publisher:PEARSON
The Basic Practice of Statistics
Statistics
ISBN:9781319042578
Author:David S. Moore, William I. Notz, Michael A. Fligner
Publisher:W. H. Freeman
Introduction to the Practice of Statistics
Statistics
ISBN:9781319013387
Author:David S. Moore, George P. McCabe, Bruce A. Craig
Publisher:W. H. Freeman