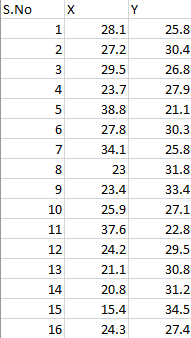
The Cadet is a popular model of sport utility vehicle, known for its relatively high resale value. The bivariate data given below were taken from a sample of sixteen Cadets, each bought new two years ago, and each sold used within the past month. For each Cadet in the sample, we have listed both the mileage x (in thousands of miles) that the Cadet had on its odometer at the time it was sold used and the price y (in thousands of dollars) at which the Cadet was sold used. With the aim of predicting the used selling price from the number of miles driven, we might examine the least-squares regression line, -42.45 -0.52x. This line is shown in the scatter plot in Figure 1. Used selling price, Mileage, x (in thousands) (in thousands of dollars) 28.1 25.8 27.2 30.4 29.5 26.8 23.7 27.9 38.8 21.1 27.8 30.3 34.1 25.8 23.0 31.8 23.4 33.4 254 25.9 27.1 37.6 22.8 20 24.2 29.5 21.1 30.8 20.8 31.2 Figure 1 15.4 34.5 24.3 27.4 Send data to Excel Using the above information, answer the following: 1. Fill in the blank: For these data, mileages that are less than the mean of the mileages tend to be paired with used selling prices that are Choose one - the mean of the used selling prices. 2. Fill in the blank: According to the regression equation, for an increase of one thousand miles in Cadet mileage, there is a corresponding of 0.52 thousand dollars in the used selling Choose one price. 3. From the regression equation, what is the predicted used selling price (in thousands of dollars) when the mileage is 21.6 thousand miles? (Round your answer to at least one decimal place.) 4. From the regression equation, what is the predicted used selling price (in thousands of dollars) when the mileage is 37.6 thousand miles? (Round your answer to at least one decimal place.)


Correlation
Correlation defines a relationship between two independent variables. It tells the degree to which variables move in relation to each other. When two sets of data are related to each other, there is a correlation between them.
Linear Correlation
A correlation is used to determine the relationships between numerical and categorical variables. In other words, it is an indicator of how things are connected to one another. The correlation analysis is the study of how variables are related.
Regression Analysis
Regression analysis is a statistical method in which it estimates the relationship between a dependent variable and one or more independent variable. In simple terms dependent variable is called as outcome variable and independent variable is called as predictors. Regression analysis is one of the methods to find the trends in data. The independent variable used in Regression analysis is named Predictor variable. It offers data of an associated dependent variable regarding a particular outcome.

Consider the following given information-
The regression is given by,

Trending now
This is a popular solution!

Step by step
Solved in 2 steps with 1 images


