
ENGR.ECONOMIC ANALYSIS
14th Edition
ISBN: 9780190931919
Author: NEWNAN
Publisher: Oxford University Press
expand_more
expand_more
format_list_bulleted
Related questions
Question
Please answer everything in the photos. The bottom question is asking if it is a overstate or an understate.
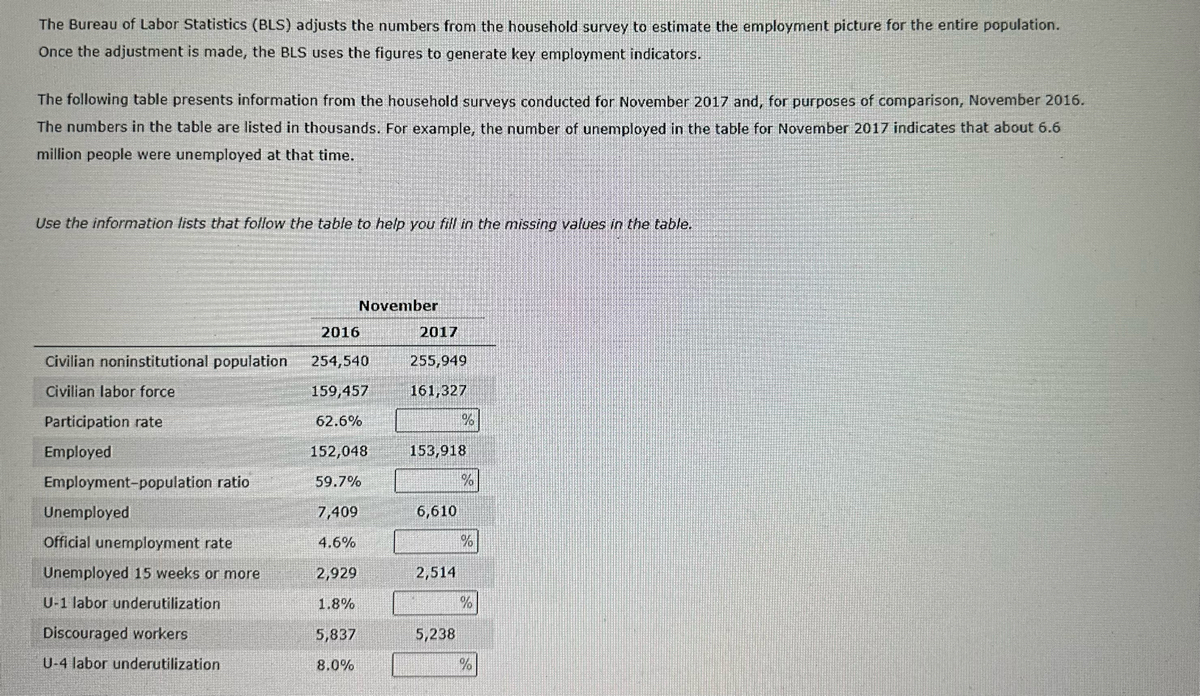

Transcribed Image Text:The Bureau of Labor Statistics (BLS) adjusts the numbers from the household survey to estimate the employment picture for the entire population.
Once the adjustment is made, the BLS uses the figures to generate key employment indicators.
The following table presents information from the household surveys conducted for November 2017 and, for purposes of comparison, November 2016.
The numbers in the table are listed in thousands. For example, the number of unemployed in the table for November 2017 indicates that about 6.6
million people were unemployed at that time.
Use the information lists that follow the table to help you fill in the missing values in the table.
Civilian noninstitutional population
Civilian labor force
Participation rate
Employed
Employment-population ratio
Unemployed
Official unemployment rate
Unemployed 15 weeks or more
U-1 labor underutilization
Discouraged workers.
U-4 labor underutilization
November
2016
254,540
159,457
62.6%
152,048
59.7%
7,409
4.6%
2,929
1.8%
5,837
8.0%
2017
255,949
161,327
153,918
6,610
2,514
5,238
%
%

Transcribed Image Text:The following list shows you how to compute the statistics most commonly used to indicate the health of an economy:
• The participation rate is the percentage of the working-age population in the labor force-either employed or searching for
employment. In November 2016, the participation rate was 254,510 x 100 = 62.6%.
159,457
• The employment-population ratio is the percentage of the working-age population that is employed. In November 2016, the
employment-population ratio was 254,540 x 100 = 59.7%.
152,048
• The official unemployment rate is the percentage of the labor force that does not have a job but is actively searching for
employment. In November 2016, the official unemployment rate was 7,409
x 100 4.6%.
159,457
To get a more accurate picture of underemployment in the economy, the BLS calculates several alternative measures of labor underutilization:
• The U-1 measure of labor underutilization measures the percentage of the labor force that has been unemployed for 15 weeks or
2,929
more at the time of the household survey. In November 2016, U-1 was 159,457 × 100 = 1.8%.
• Another measure, the U-4 measure of labor underutilization, treats discouraged workers as though they were unemployed and
part of the labor force. To calculate U-4, the BLS divides the sum of unemployed and discouraged workers by the sum of the labor
7,40915,837
force and discouraged workers. In November 2016, U-4 was
x 100 = 8.0%.
159,45715,837
Based on the numbers in the previous table, indicate whether each of the following statements accurately describes the differences in the employment
situation between November 2016 and November 2017.
Statement
The typical unemployed worker in November 2017 was more likely to have been unemployed for 15 weeks or more than the
typical unemployed worker in November 2016.
A smaller number of jobless people who wanted a job and were available to work had given up on their job search in November
2017 compared to November 2016.
The U-1 and U-4 measures of labor underutilization were lower in November 2017 than they were in November 2016.
In November 2017, a larger fraction of the civilian noninstitutional population was employed than in November 2016.
A smaller fraction of the civilian noninstitutional population was in the labor force in November 2017 than in November 2016.
The official unemployment rate and the U-4 measure of labor underutilization are two different measures of joblessness in the economy.
Excluding discouraged workers from the official unemployment rate may cause the official rate to
underemployment.
True
the true extent of
O
False
O
O
O
O
O
Expert Solution
This question has been solved!
Explore an expertly crafted, step-by-step solution for a thorough understanding of key concepts.

This is a popular solution

Trending nowThis is a popular solution!

Step by stepSolved in 5 steps

Knowledge Booster


Learn more about
Need a deep-dive on the concept behind this application? Look no further. Learn more about this topic, economics and related others by exploring similar questions and additional content below.Similar questions
- What is the relevance of a website for a business ? Discuss it with various departmental factors.arrow_forwardCan I see part A - D ?arrow_forwardWhy do people share content via social media channels? They find it interesting and/or entertaining. They think it can be helpful to others. They want to get a laugh. A & B Only. All of these.arrow_forward
arrow_back_ios
arrow_forward_ios
Recommended textbooks for you
 Principles of Economics (12th Edition)EconomicsISBN:9780134078779Author:Karl E. Case, Ray C. Fair, Sharon E. OsterPublisher:PEARSON
 Engineering Economy (17th Edition)EconomicsISBN:9780134870069Author:William G. Sullivan, Elin M. Wicks, C. Patrick KoellingPublisher:PEARSON
 Principles of Economics (MindTap Course List)EconomicsISBN:9781305585126Author:N. Gregory MankiwPublisher:Cengage Learning
 Managerial Economics: A Problem Solving ApproachEconomicsISBN:9781337106665Author:Luke M. Froeb, Brian T. McCann, Michael R. Ward, Mike ShorPublisher:Cengage Learning
 Managerial Economics & Business Strategy (Mcgraw-...EconomicsISBN:9781259290619Author:Michael Baye, Jeff PrincePublisher:McGraw-Hill Education
Principles of Economics (12th Edition)
Economics
ISBN:9780134078779
Author:Karl E. Case, Ray C. Fair, Sharon E. Oster
Publisher:PEARSON
Engineering Economy (17th Edition)
Economics
ISBN:9780134870069
Author:William G. Sullivan, Elin M. Wicks, C. Patrick Koelling
Publisher:PEARSON
Principles of Economics (MindTap Course List)
Economics
ISBN:9781305585126
Author:N. Gregory Mankiw
Publisher:Cengage Learning
Managerial Economics: A Problem Solving Approach
Economics
ISBN:9781337106665
Author:Luke M. Froeb, Brian T. McCann, Michael R. Ward, Mike Shor
Publisher:Cengage Learning
Managerial Economics & Business Strategy (Mcgraw-...
Economics
ISBN:9781259290619
Author:Michael Baye, Jeff Prince
Publisher:McGraw-Hill Education