
MATLAB: An Introduction with Applications
6th Edition
ISBN: 9781119256830
Author: Amos Gilat
Publisher: John Wiley & Sons Inc
expand_more
expand_more
format_list_bulleted
Related questions
Question
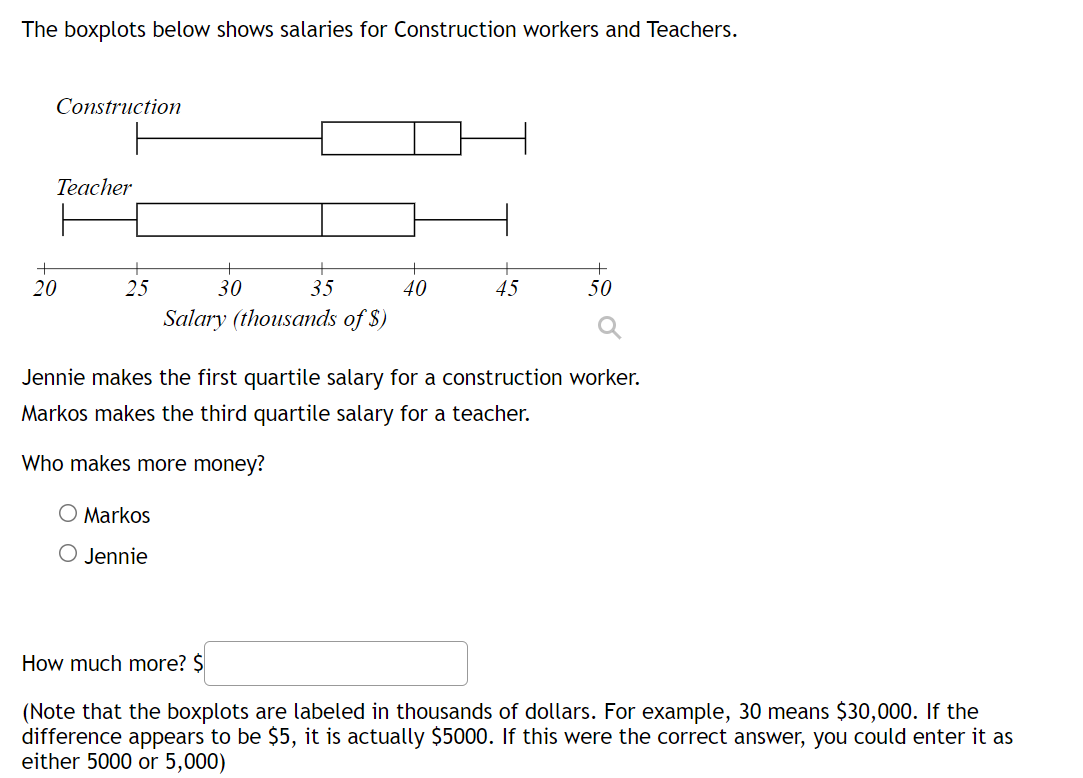

Transcribed Image Text:The boxplots below shows salaries for Construction workers and Teachers.
Construction
Teacher
+
20
25
30
35
40
45
50
Salary (thousands of $)
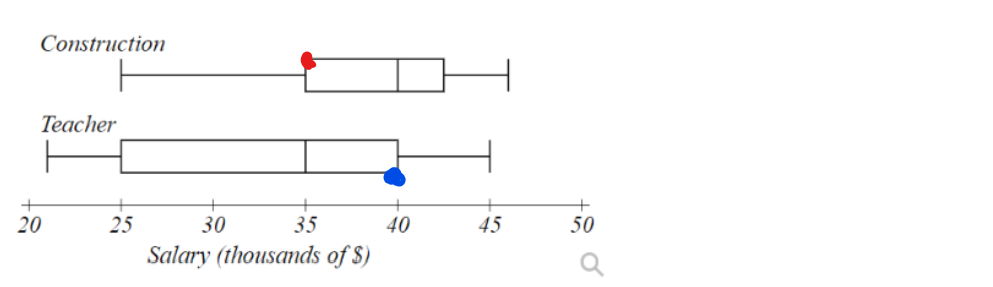
Jennie makes the first quartile salary for a construction worker.
Markos makes the third quartile salary for a teacher.
Who makes more money?
O Markos
O Jennie
How much more? $
(Note that the boxplots are labeled in thousands of dollars. For example, 30 means $30,000. If the
difference appears to be $5, it is actually $5000. If this were the correct answer, you could enter it as
either 5000 or 5,000)
Expert Solution
arrow_forward
Step 1

Trending nowThis is a popular solution!

Step by stepSolved in 4 steps with 1 images

Knowledge Booster

Similar questions
- The boxplot below shows salaries for Construction workers and Teachers. Construction Teacher 23 24 25 26 27 28 29 30 31 32 33 34 35 36 37 38 39 40 41 42 43 Salary (thousands of S) Q Jennie makes the first quartile salary for a construction worker. Markos makes the first quartile salary for a teacher. Who makes more money? O Markos Jennie How much more? $arrow_forwardYou have the following data on consumption and income (in $10,000s). Income 9 11 5 8 2 9 12 Consumption 7 7 2 7 2 8 9 Make a scatterplot and draw the line of best fit.arrow_forwardPART D TO BE ANSWERED! Thank you!arrow_forward
- 3190 You're a data analyst for an insurance company. You want to make sure that your employer is not over-paying for car repairs. To investigate this, you bring 31 different cars to two different garages, Bubba's Hubcap Heaven and Repair, and Merle's Motor Shop. Some of the cars need lots of repairs. Some of the cars need very few. By taking each car to both shops, we can directly compare the two sets of prices. Before running your analysis, be sure to look at the data file and verify that each car requires a different amount of repairs, and that prices in one shop are correlated with prices at the other shop. That is, they're in the same ballpark. The question is whether one tends to charge more, on average, than the other. Your task is to use Excel to test the research hypothesis that prices are different in the two shops; the null hypothesis is that prices are equal between the two shops. You test at the alpha = 0.10 significance level. What do you conclude? Are prices the same?…arrow_forwardWhat is the coefficient of the dummy variable? What is the meaning of the coefficient of the dummy variable?arrow_forwardQuestion Completion Status: Company A, Company B, and Company C sold a number of stocks each month in 2019. Each company described their stock sales in the box plots shown below. Which box plot is most left-skewed? Company A Company B Company C Save All Ar Click Save and Submit to save and submit. Click Save All Answers to save all answers. * Relative Worksheet Py....docx Reading - Mappi..pdf A W MLK Letter -2.pdf W Worksheet - W....docx 四田07A DIC. ostv 11arrow_forward
arrow_back_ios
arrow_forward_ios
Recommended textbooks for you
- MATLAB: An Introduction with ApplicationsStatisticsISBN:9781119256830Author:Amos GilatPublisher:John Wiley & Sons Inc
 Probability and Statistics for Engineering and th...StatisticsISBN:9781305251809Author:Jay L. DevorePublisher:Cengage Learning
 Statistics for The Behavioral Sciences (MindTap C...StatisticsISBN:9781305504912Author:Frederick J Gravetter, Larry B. WallnauPublisher:Cengage Learning
  Elementary Statistics: Picturing the World (7th E...StatisticsISBN:9780134683416Author:Ron Larson, Betsy FarberPublisher:PEARSON
 The Basic Practice of StatisticsStatisticsISBN:9781319042578Author:David S. Moore, William I. Notz, Michael A. FlignerPublisher:W. H. Freeman
 Introduction to the Practice of StatisticsStatisticsISBN:9781319013387Author:David S. Moore, George P. McCabe, Bruce A. CraigPublisher:W. H. Freeman
MATLAB: An Introduction with Applications
Statistics
ISBN:9781119256830
Author:Amos Gilat
Publisher:John Wiley & Sons Inc
Probability and Statistics for Engineering and th...
Statistics
ISBN:9781305251809
Author:Jay L. Devore
Publisher:Cengage Learning
Statistics for The Behavioral Sciences (MindTap C...
Statistics
ISBN:9781305504912
Author:Frederick J Gravetter, Larry B. Wallnau
Publisher:Cengage Learning
Elementary Statistics: Picturing the World (7th E...
Statistics
ISBN:9780134683416
Author:Ron Larson, Betsy Farber
Publisher:PEARSON
The Basic Practice of Statistics
Statistics
ISBN:9781319042578
Author:David S. Moore, William I. Notz, Michael A. Fligner
Publisher:W. H. Freeman
Introduction to the Practice of Statistics
Statistics
ISBN:9781319013387
Author:David S. Moore, George P. McCabe, Bruce A. Craig
Publisher:W. H. Freeman