MATLAB: An Introduction with Applications
6th Edition
ISBN: 9781119256830
Author: Amos Gilat
Publisher: John Wiley & Sons Inc
expand_more
expand_more
format_list_bulleted
Question

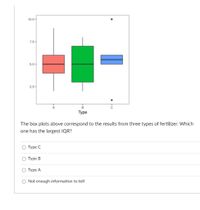
Transcribed Image Text:10.0-
7.5-
5.0-
2.5-
Туре
The box plots above correspond to the results from three types of fertilizer. Which
one has the largest IQR?
О Туре С
O Type B
О Туре А
Not enough information to tell
Expert Solution
This question has been solved!
Explore an expertly crafted, step-by-step solution for a thorough understanding of key concepts.
This is a popular solution
Trending nowThis is a popular solution!
Step by stepSolved in 2 steps

Knowledge Booster
Similar questions
- I can't understand why the data is the percentage of surveyed parents.arrow_forwardA pet store surveys 20 people who enter the store to ask how many pets each shopper has. The results are included in the table below. Use Excel to create a histogram of the data, and then interpret the plot. Set the first bin maximum to 0 and the increment to 1. Number of Pets 0 0 1 3 1 6 2 4 1arrow_forwardI need help with the questions 2a,2b and 2c. Describe the shape of the distribution of the data. Which movie has the largest budget With all the data obtained, which genre movie tend to have larger budgets.arrow_forward
- Aspirin prevents blood from clotting and helps prevent strokes. The Second European Stroke Prevention Study asked whether adding another anticlotting drug named dipyridamole would make a difference for patients who had already had a stroke. Here are the data on strokes during the two years of the study: Aspirin alone Apsirin & Dipyridamole Number of Patients This test is two-t led. What is the test statistic? -2.700 200 = V 200 Is there a significant difference in the proportion of strokes in the two groups? Test at a = 0.05. Round your answers to three decimal places, and round any interim calculations to four decimal places. #v Fill in the hypotheses below where p₁ denotes the proportion of patients in the aspirin group who suffered a stroke and på denotes the proportion of patients in the aspirin & dipyridamole group who suffered a stroke. Ho: P₁ Ha: P₁ Number of Strokes P₂ 60 P₂ 86 Using your answer from the previous question, find the p-value. ▼ Part 2 of 4 Part 3 of 4arrow_forwardA Hospital record for a patient indicates the patient's assigned department, room location and number of days the patient was treated. Classify each variable as qualitative or quantitative. A sample data table is listed below. Department Room Location Days of Treatment Maternity A102 2 Cardiac G210 5 Orthopedic C309 3arrow_forwardA consumer research company wants to estimate the average cost of an airline ticket for a round trip within the continental United States. A random sample of 50 airfares was gathered giving an average price of $438. Identify the variable. A. Random sample of 50 airfares C. Consumer research company B. Airline Fare D. Quantitative E. $38arrow_forward
- L4Q2.Which one of the following scatter plots best describes the given data?arrow_forwardShow your work in the box below. Given this set of data: 4, 9, 8, 2, 16, 4, 4, 9, 6. Find the following and label your parts: a. mean b. mode c. rangearrow_forwardSince 1994, the Best Roller Coaster Poll has been ranking the world's roller coasters. In 2013, Bizarro dropped to 4th after eaming the top steel coaster rank for six straight years. Data on 11 of the top steel coasters from this poll are presented in the accompanying lable What do these data indicate about the Length of the track and the Duration of the ride you can expect? E Click the icon to view the steel coaster data. Construct a scatterplot of the data. Choose the correct plot below. A. OB. O D. Q 240 240 240- 240 40 2000 6000 Length (A) 40 2000 6000 2 40 2000 6000 (2 Length () 40 2000 Length () 6000 ( Length (n) Find the correlation coefficient. Steel coaster data (Round to three decimal places as Маx Max Vert Duration Height Speed (sec) Length (ft) Initial Angle Rank Roller Coaster (mph) (degrees) Park 1 Expedition GeForce Holiday Park Six Flags Kings Dominion SF New England Hersheypark Cedar Point PortAventua Six Flags Mirabilandia Location Drop (ft) (ft) DE 184 75 188 74.6 82…arrow_forward
arrow_back_ios
arrow_forward_ios
Recommended textbooks for you
 MATLAB: An Introduction with ApplicationsStatisticsISBN:9781119256830Author:Amos GilatPublisher:John Wiley & Sons Inc
 Probability and Statistics for Engineering and th...StatisticsISBN:9781305251809Author:Jay L. DevorePublisher:Cengage Learning
 Statistics for The Behavioral Sciences (MindTap C...StatisticsISBN:9781305504912Author:Frederick J Gravetter, Larry B. WallnauPublisher:Cengage Learning
 Elementary Statistics: Picturing the World (7th E...StatisticsISBN:9780134683416Author:Ron Larson, Betsy FarberPublisher:PEARSON
 The Basic Practice of StatisticsStatisticsISBN:9781319042578Author:David S. Moore, William I. Notz, Michael A. FlignerPublisher:W. H. Freeman
 Introduction to the Practice of StatisticsStatisticsISBN:9781319013387Author:David S. Moore, George P. McCabe, Bruce A. CraigPublisher:W. H. Freeman

MATLAB: An Introduction with Applications
Statistics
ISBN:9781119256830
Author:Amos Gilat
Publisher:John Wiley & Sons Inc

Probability and Statistics for Engineering and th...
Statistics
ISBN:9781305251809
Author:Jay L. Devore
Publisher:Cengage Learning

Statistics for The Behavioral Sciences (MindTap C...
Statistics
ISBN:9781305504912
Author:Frederick J Gravetter, Larry B. Wallnau
Publisher:Cengage Learning

Elementary Statistics: Picturing the World (7th E...
Statistics
ISBN:9780134683416
Author:Ron Larson, Betsy Farber
Publisher:PEARSON

The Basic Practice of Statistics
Statistics
ISBN:9781319042578
Author:David S. Moore, William I. Notz, Michael A. Fligner
Publisher:W. H. Freeman

Introduction to the Practice of Statistics
Statistics
ISBN:9781319013387
Author:David S. Moore, George P. McCabe, Bruce A. Craig
Publisher:W. H. Freeman