The average salary for American college graduates is $48,600. You suspect that the average is less for graduates from your college. The 49 randomly selected graduates from your college had an average salary of $46,486 and a standard deviation of $9,200. What can be concluded at the αα = 0.01 level of significance?
- For this study, we should use Select an answer t-test for a population mean z-test for a population proportion
- The null and alternative hypotheses would be:
H0:H0: ? p μ Select an answer = ≠ > <
H1:H1: ? μ p Select an answer > ≠ = <
- The test statistic ? z t = (please show your answer to 3 decimal places.)
- The p-value = (Please show your answer to 4 decimal places.)
- The p-value is ? > ≤ αα
- Based on this, we should Select an answer reject accept fail to reject the null hypothesis.
- Thus, the final conclusion is that .
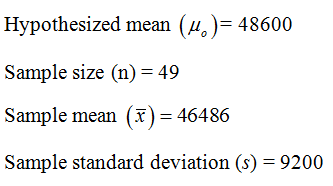
The provided information are:

The appropriate null and alternative hypotheses are:

The alternative hypothesis suggests that the test is left-tailed
(1)
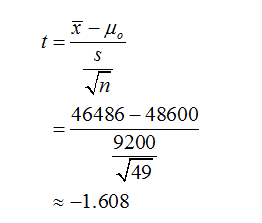
Here, the population standard deviation is unknown, so the appropriate test is t-test.
The test statistic can be calculated as:

The sample size (n) is 49.
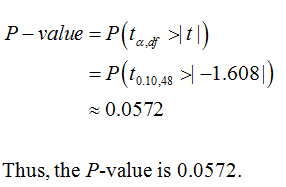
Degrees of freedom (df) = n-1 = 49-1=48
(2)
The P-value can be calculated as:

Step by stepSolved in 5 steps with 4 images

- On the PSAT test taken by about 1.5 million high school juniors each year, the mean score on the reading portion of the test was 46.9, with a standard deviation of 10.9. The scores are normally distributed. If a student needed a score on this portion of the test that put them in the top 5% of scores nationally to qualify for a particular scholarship, what is the minimum score they must achieve?arrow_forwardTwo brands of batteries are tested, and their voltages are compared. The summary statistics follow. For sample 1, the sample size is 27; the population standard deviation is 0.3 volts and the mean is 9.2 volts. For sample 2, the sample size is 30; the population standard deviation is 0.1 volts and the mean is 8.8 volts. Is the mean of sample 1 smaller than the mean of sample 2? Using a significance level of 0.05. a) Identify the claim and state the hypotheses. b) What is the test statistics? Find the critical values (s). c) Make the decision to reject or not reject the null hypothesis and explain why. d) Graph your decision and include all the values. That is, the mean, the standard deviation, the critical value(s), the rejection region. e) Set up the formula with the correct numbers for the 95% confidence interval of the mean number of jobs.arrow_forwardThe Army reports that the distribution of head circumferences among male soldiers is approximately normal with μ =22.8 inches and σ = 1.1 inches. What is the circumference of a soldier whose head is 2.34 standard deviations above the mean?arrow_forward
- Assume that the heights of women are normally distributed with a mean of 62.4 inches and a standard deviation of 1.6 inches. Find Q3 the third quartile that separates the bottom 75% from the top 25%arrow_forwardChoose the appropriate statistical test. When computing, be sure to round each answer as indicated. A dentist wonders if depression affects ratings of tooth pain. In the general population, using a scale of 1-10 with higher values indicating more pain, the average pain rating for patients with toothaches is 6.8. A sample of 30 patients that show high levels of depression have an average pain rating of 7.1 (variance 0.8). What should the dentist determine? 1. Calculate the estimated standard error. (round to 3 decimals). [st.error] 2. What is thet-obtained? (round to 3 decimals). 3. What is the t-cv? (exact value) 4. What is your conclusion? Only type "Reject" or Retain"arrow_forwardIn the class of 2019, more than 1.6 million students took the SAT. The distribution of scores on the math section (out of 800) is approximately normal with a mean of 528 and standard deviation of 117. What proportion of students earned scores between 500 and 600 on the SAT math test?arrow_forward
- A sports writer wished to see if a football filled with helium travels farther, on average, than a football filled with air. To test this, the writer used 18 adult male volunteers. These volunteers were randomly divided into two groups of nine men each. Group 1 kicked a football that was filled with helium to the recommended pressure. Group 2 kicked a football that was filled with air to the recommended pressure. The mean yardage for Group 1 was ?¯1=300 yards with a standard deviation of ?1=8 yards. The mean yardage for Group 2 was ?¯2=296 yards with a standard deviation of ?2=6 yards. Assume the two groups of kicks are independent. Let ?1 and ?2 represent the mean yardage we would observe for the entire population represented by the volunteers if all members of this population kicked, respectively, a helium‑filled football and an air‑filled football. Assuming two‑sample ? procedures are safe to use and using Option 1 for the degrees of freedom, a 90% confidence interval for ?1−?2 is:…arrow_forwardIn a study of birth order and intelligence, IQ tests were given to 18- and 19-year-old men to estimate the size of the difference, if any, between the mean IQs of firstborn sons and secondborn sons. The following data for 10 firstborn sons and 10 secondborn sons are consistent with the means and standard deviations reported in the article. It is reasonable to assume that the samples come from populations that are approximately normal. Can you conclude that the mean IQ of firstborn sons is greater than the mean IQ of secondborn sons? Let μ1 denote the mean IQ of firstborn sons and μ2 denote the mean IQ of secondborn sons. Use the α = 0.01 level and the P-value method with the table. Firstborn 128 101 128 112 121 105 122 98 106 108 Secondborn 121 125 110 107 114 93 80 94 91 83 Part(a): State the appropriate null and alternate hypotheses. H0: H1: This is a _____…arrow_forwardIn 16 women with diabetes, the morning blood sugar mean was 49.4 with a standard deviation of 24.0. In normal healthy women, the mean was 47.0. From the sample information, can we conclude that the blood sugar mean in women with rheumatoid arthritis is greater than that in normal women? Assume a significance level of 0.05.arrow_forward
- Almost all medical schools in the United States require applicants to take the Medical College Admission Test (MCAT). On one exam, the scores of all applicants on the biological sciences part of the MCAT were approximately Normal with mean 9.4 and standard deviation 2.6. For applicants who actually entered medical school, the mean score was 10.6 and the standard deviation was 1.7. (a) What percent of all applicants had scores higher than 11? (b) What percent of those who entered medical school had scores between 8 and 12?arrow_forwardWhat is the z score for 20 if mean =18 and stadnard deviation =0.5arrow_forward
 MATLAB: An Introduction with ApplicationsStatisticsISBN:9781119256830Author:Amos GilatPublisher:John Wiley & Sons Inc
 Probability and Statistics for Engineering and th...StatisticsISBN:9781305251809Author:Jay L. DevorePublisher:Cengage Learning
 Statistics for The Behavioral Sciences (MindTap C...StatisticsISBN:9781305504912Author:Frederick J Gravetter, Larry B. WallnauPublisher:Cengage Learning
 Elementary Statistics: Picturing the World (7th E...StatisticsISBN:9780134683416Author:Ron Larson, Betsy FarberPublisher:PEARSON
 The Basic Practice of StatisticsStatisticsISBN:9781319042578Author:David S. Moore, William I. Notz, Michael A. FlignerPublisher:W. H. Freeman
 Introduction to the Practice of StatisticsStatisticsISBN:9781319013387Author:David S. Moore, George P. McCabe, Bruce A. CraigPublisher:W. H. Freeman


