
MATLAB: An Introduction with Applications
6th Edition
ISBN: 9781119256830
Author: Amos Gilat
Publisher: John Wiley & Sons Inc
expand_more
expand_more
format_list_bulleted
Related questions
Question
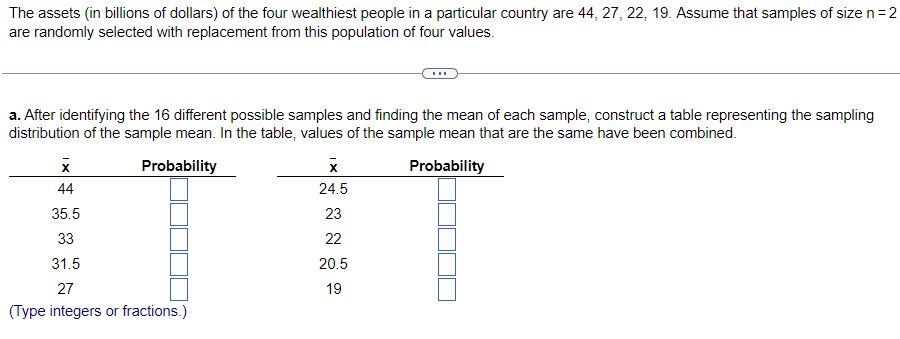

Transcribed Image Text:The assets (in billions of dollars) of the four wealthiest people in a particular country are 44, 27, 22, 19. Assume that samples of size n = 2
are randomly selected with replacement from this population of four values.
a. After identifying the 16 different possible samples and finding the mean of each sample, construct a table representing the sampling
distribution of the sample mean. In the table, values of the sample mean that are the same have been combined.
Probability
Probability
X
44
35.5
33
31.5
27
(Type integers or fractions.)
****
X
24.5
23
22
20.5
19
Expert Solution
This question has been solved!
Explore an expertly crafted, step-by-step solution for a thorough understanding of key concepts.

This is a popular solution

Trending nowThis is a popular solution!

Step by stepSolved in 3 steps with 1 images

Knowledge Booster

Similar questions
- Decide whether the random variable x is discrete or continuous. Explain your reasoning. Let x represent the temperature of a person taken with a mercury thermometer. Is the random variable x discrete or continuous? Choose the correct answer below. O A. Discrete, because x is a random variable that can be counted. O B. Continuous, because x is a random variable that cannot be counted.arrow_forwardParts c, d, and farrow_forwardRefer to the accompanying table, which describes results from groups of 8 births from 8 different sets of parents. The random variable x represents the number of girls among 8 children. Find the mean and standard deviation for the number of girls in 8 births. Click the icon to view the data table. Table of numbers of girls and probabilities - X The mean is μ= girl(s). (Round to one decimal place as needed.) Number of Girls x P(x) 0 0.005 0.026 2 0.115 3 0.217 4 0.266 5 0.228 6 0.105 7 0.033 8 0.005arrow_forward
- Suppose it is known that 37% of Camp Crystal Lake campers return the next summer. A random sample of 15 campers was selected. 3. (Describe the distribution of the number of campers that return the next summer.arrow_forwardInsurance componies track life expertancy info to assist in determining the cost of life insurance polocies. The insurance compony knows that last year the life expectancy of its polocy holders was 77 years. They want to know if their clients this year have a longer life expectancy, on average, so the company randomy samples some of the recently paid polices to see if the mean life expectancy of polcy holders has increased. Sample: 86,75, 83, 84, 81, 77, 78, 79, 79,81, 76, 85, 70,76, 79,81, 73, 74, 72, 83. 1) Does this sample indicate that the insurance company should change its premiums because life expectancy has increased? 2) For more accurate cost determination, the insurance companies want to estimate the life expectancy to within one year with 95% confidence. How many randomly selected records would you need to have?arrow_forwardHelp please week 7arrow_forward
- I need help with this one please thank you.arrow_forwardWhat effect does increasing the sample size have on the probability? Provide an explanation for this result. Choose the correct answer below. A. The probability increases because the variability in the sample mean decreases as the sample size increases. B. The probability increases because the variability in the sample mean increases as the sample size increases. C. The probability decreases because the variability in the sample mean increases as the sample size increases. D. The probability decreases because the variability in the sample mean decreases as the sample size increases.arrow_forwardThe ages (in years) of a random sample of shoppers at a gaming store are shown. Determine the range, mean, variance, and standard deviation of the sample data set. 12, 20, 23, 13, 18, 17, 22, 17, 15, 16 The range is The mean is ( Simplify your answer. Round to the nearest tenth as needed.) The variance is (Simplify your answer. Round to the nearest hundredth as needed.) The standard deviation is (Simplify your answer. Round to the nearest tenth as needed.) Can you please explain me this math problem having trouble understanding. Thank you.arrow_forward
- fill in blank, there are only 3 options, decreases, increases or remain the same.arrow_forwardFive pulse rates are randomly selected from a set of measurements. The five pulse rates have a mean of 67.0 beats per minute. Four of the pulse rates are 54, 82, 53, and 90. a. Find the missing value. b. Suppose that you need to create a list of n values that have a specific known mean. Some of the n values can be freely selected. How many of the n values can be freely assigned before the remaining values are determined? (The result is referred to as the number of degrees of freedom.) a. The missing value is beats per minute. (Type an integer or a decimal. Do not round.)arrow_forwardFive pulse rates are randomly selected from a set of measurements. The five pulse rates have a mean of 76.6 beats per minute. Four of the pulse rates are 82, 59, 84, and 89. a. Find the missing value. b. Suppose that you need to create a list of n values that have a specific known mean, Some of the n values can be freely selected. How many of the n values can be freely assigned before the remaining values are determined? (The result is referred to as the number of degrees of freedom.)arrow_forward
arrow_back_ios
SEE MORE QUESTIONS
arrow_forward_ios
Recommended textbooks for you
- MATLAB: An Introduction with ApplicationsStatisticsISBN:9781119256830Author:Amos GilatPublisher:John Wiley & Sons Inc
 Probability and Statistics for Engineering and th...StatisticsISBN:9781305251809Author:Jay L. DevorePublisher:Cengage Learning
 Statistics for The Behavioral Sciences (MindTap C...StatisticsISBN:9781305504912Author:Frederick J Gravetter, Larry B. WallnauPublisher:Cengage Learning
  Elementary Statistics: Picturing the World (7th E...StatisticsISBN:9780134683416Author:Ron Larson, Betsy FarberPublisher:PEARSON
 The Basic Practice of StatisticsStatisticsISBN:9781319042578Author:David S. Moore, William I. Notz, Michael A. FlignerPublisher:W. H. Freeman
 Introduction to the Practice of StatisticsStatisticsISBN:9781319013387Author:David S. Moore, George P. McCabe, Bruce A. CraigPublisher:W. H. Freeman
MATLAB: An Introduction with Applications
Statistics
ISBN:9781119256830
Author:Amos Gilat
Publisher:John Wiley & Sons Inc
Probability and Statistics for Engineering and th...
Statistics
ISBN:9781305251809
Author:Jay L. Devore
Publisher:Cengage Learning
Statistics for The Behavioral Sciences (MindTap C...
Statistics
ISBN:9781305504912
Author:Frederick J Gravetter, Larry B. Wallnau
Publisher:Cengage Learning
Elementary Statistics: Picturing the World (7th E...
Statistics
ISBN:9780134683416
Author:Ron Larson, Betsy Farber
Publisher:PEARSON
The Basic Practice of Statistics
Statistics
ISBN:9781319042578
Author:David S. Moore, William I. Notz, Michael A. Fligner
Publisher:W. H. Freeman
Introduction to the Practice of Statistics
Statistics
ISBN:9781319013387
Author:David S. Moore, George P. McCabe, Bruce A. Craig
Publisher:W. H. Freeman