A First Course in Probability (10th Edition)
10th Edition
ISBN: 9780134753119
Author: Sheldon Ross
Publisher: PEARSON
expand_more
expand_more
format_list_bulleted
Question

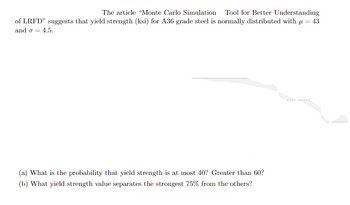
Transcribed Image Text:The article "Monte Carlo Simulation Tool for Better Understanding
of LRFD" suggests that yield strength (ksi) for A36 grade steel is normally distributed with = 43
and o = 4.5.
(a) What is the probability that yield strength is at most 40? Greater than 60?
(b) What yield strength value separates the strongest 75% from the others?
Expert Solution
This question has been solved!
Explore an expertly crafted, step-by-step solution for a thorough understanding of key concepts.
This is a popular solution
Trending nowThis is a popular solution!
Step by stepSolved in 4 steps

Knowledge Booster
Similar questions
- T/F: An R^2 value near 100% indicates that there is a strong causal relationship between the response and the predictor variables. T/F: Standard deviation of the sum of two independent random variables is the sum of their standard deviations.arrow_forwardThe reaction time in a chemical process (in seconds) is normally distributed with a mean of 2.94 and variance of 0.68.(a) What is the probability that the reaction time is exactly 2.94 seconds?(b) What is the probability that the reaction time is at least three seconds, given that it is less than 3.5 seconds?arrow_forwardSuppose the avg score on Midt1 is usually 92, and on Midt2 is 74. If your final grade is weighted 0.61 and 0.39 for Midt1 and Midt2, respectively, what is the expected final course grade? (i.e. what is E(a*Midt1 + b*Midt2)? (Please round to two decimal places: ex: 12.34)arrow_forward
- An elephant eats an average of 3 bushels of alfalfa per day, with a standarddeviation of 0.8 bushels. Suppose that you need to feed 10 elephants for oneweek. If the distribution is normal, what is the minimum number of bushels ofalfalfa so that there is no more than a 10% chance of running out by the end of the week?arrow_forwardYou believe that your morning commute to UCLA is decreasing every week. You record thetime of 7 commutes (one for each day of the week) (in minutes) for the a one-week block and thenthe following one-week block. * Calculations have been done for you: the sample mean difference is -1.714 and the sample standarddeviation is 2.984. Conduct a hypothesis test at the α = 0.15 level. The mean difference calculated as the the first one-week block minus the second one-week block. That is to say week one minus week two. a. Set up the null and alternative hypothesis (using mathematical notation/numbers and interpretthem in context of the problem) b. Calculate the test statistic for the test from part aarrow_forward(b) A company has 16 cars of this model in its fleet. What is the probability that the average NOX + NMOG level x¯ of these cars is above 90 mg/mi? - life for one car model vary Normally with mean 84 mg/mi and standard deviation 6 mg/miarrow_forward
arrow_back_ios
arrow_forward_ios
Recommended textbooks for you
 A First Course in Probability (10th Edition)ProbabilityISBN:9780134753119Author:Sheldon RossPublisher:PEARSON

A First Course in Probability (10th Edition)
Probability
ISBN:9780134753119
Author:Sheldon Ross
Publisher:PEARSON
