
MATLAB: An Introduction with Applications
6th Edition
ISBN: 9781119256830
Author: Amos Gilat
Publisher: John Wiley & Sons Inc
expand_more
expand_more
format_list_bulleted
Related questions
Question
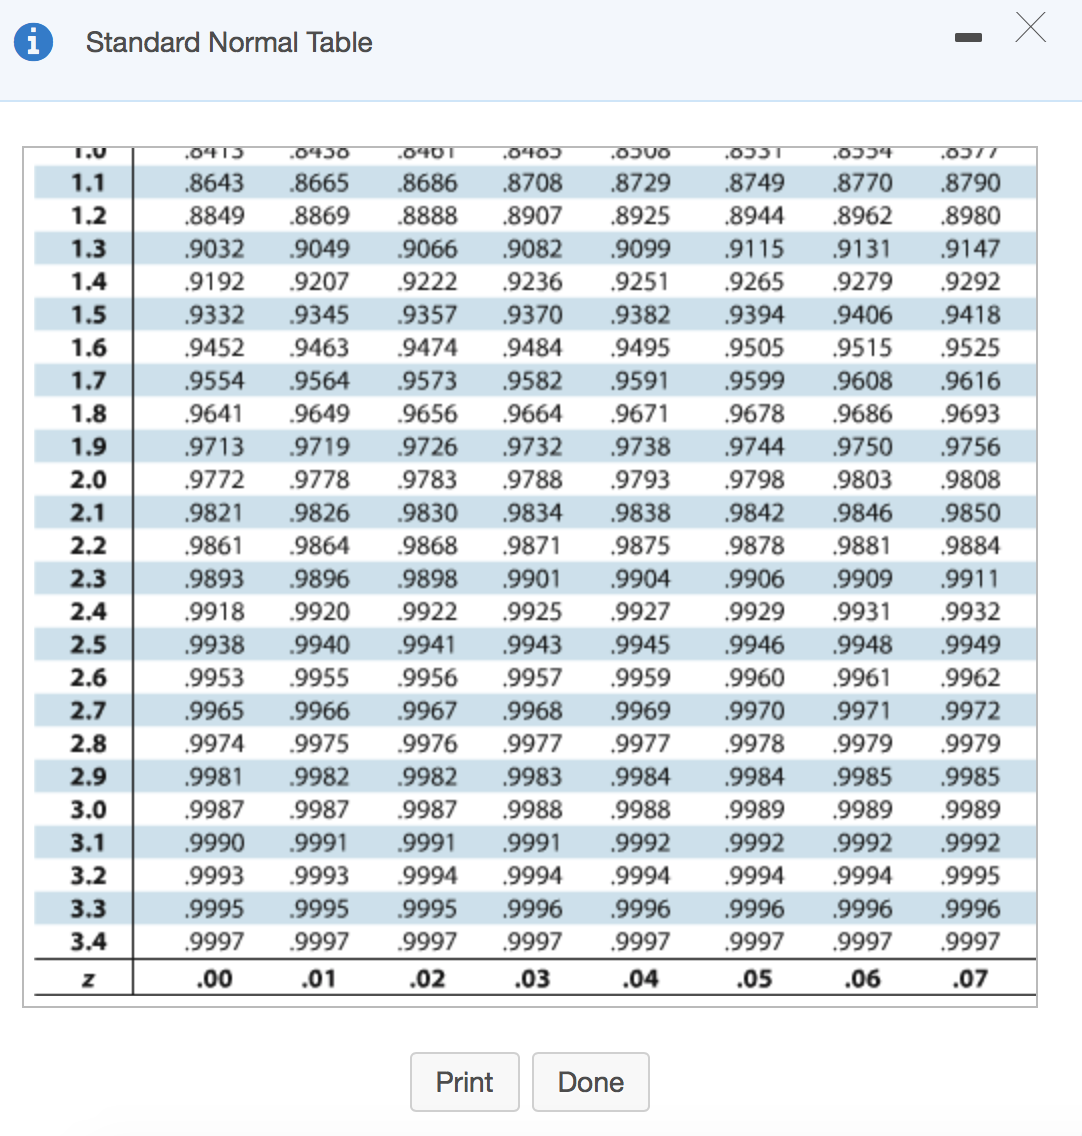

Transcribed Image Text:Standard Normal Table
.0413
.04J0
.0401
.040)
1.1
.8643
.8665
.8686
.8708
.8729
.8749
.8770
.8790
1.2
.8849
.8869
.8888
.8907
.8925
.8944
.8962
.8980
1.3
.9032
.9049
.9066
.9082
.9099
.9115
.9131
.9147
1.4
.9192
.9207
.9222
.9236
.9251
.9265
.9279
.9292
1.5
.9332
.9345
.9357
.9370
.9382
.9394
.9406
.9418
1.6
.9452
.9463
.9474
.9484
.9495
.9505
.9515
.9525
1.7
.9554
.9564
.9573
.9582
.9591
.9599
.9608
.9616
1.8
.9641
.9649
.9656
.9664
.9671
.9678
.9686
.9693
1.9
.9713
.9719
.9726
.9732
.9738
.9744
.9750
.9756
2.0
.9772
.9778
.9783
.9788
.9793
.9798
.9803
.9808
2.1
.9821
.9826
.9830
.9834
.9838
.9842
.9846
.9850
2.2
.9861
.9864
.9868
.9871
.9875
.9878
.9881
.9884
.9906
.9929
2.3
.9893
.9896
.9898
.9901
.9904
.9909
.9911
2.4
.9918
.9920
.9922
.9925
.9927
.9931
.9932
2.5
.9938
.9940
.9941
.9943
.9945
.9946
.9948
.9949
2.6
.9953
.9955
.9956
.9957
.9959
.9960
.9961
.9962
2.7
.9965
.9966
.9967
.9968
.9969
.9970
.9971
.9972
2.8
.9974
.9975
.9976
.9977
.9977
.9978
.9979
.9979
2.9
.9981
.9982
.9982
.9983
.9984
.9984
.9985
.9985
3.0
.9987
.9987
.9987
.9988
.9988
.9989
.9989
.9989
3.1
.9990
.9991
.9991
.9991
.9992
.9992
.9992
.9992
3.2
.9993
.9993
.9994
.9994
.9994
.9994
.9994
.9995
3.3
.9995
.9995
.9995
.9996
.9996
.9996
.9996
.9996
3.4
.9997
.9997
.9997
.9997
.9997
.9997
.9997
.9997
.00
.01
.02
.03
.04
.05
.06
.07
Print
Done

Transcribed Image Text:Safari
File
Edit
View
History
Bookmarks
Develop Window
Help
31%
Thu 5:53 AM
mathxl.com
Course Home
Do Homework - Section 5.1 Homework
Do Homework - Shaza Alhajri
Search Textbook Solutions | Chegg.com
Fail 2020 - STAT 300 (19124)
Shaza Alhajri
10/14/20 10:53 PM
Homework: Section 5.1 Homework
Save
Score: 0 of 1 pt
7 of 17 (7 complete)
HW Score: 35.29%, 6 of 17 pts
X5.1.19
Question Help
Standard Normal Table
Find the area of the shaded region under the standard normal curve.
.00
.01
.02
.03
.04
.05
.06
.07
.08
.09
Click here to view the standard normal table.
0.0
.5000
.5040
.5080
.5120
.5160
.5199
.5239
.5279
.5319
.5359
0.0
0.1
.5398
.5438
5478
.5517
.5557
.5596
.5636
.5675
.5714
.5753
0.1
0.2
.5793
.5832
.5871
.5910
.5948
.5987
.6026
.6064
.6103
.6141
0.2
0.3
.6179
.6217
.6255
.6293
.6331
.6368
.6406
.6443
.6480
.6517
0.3
z= 1.12
0.4
.6554
.6591
.6628
.6664
.6700
.6736
.6772
.6808
.6844
.6879
0.4
0.5
.6915
.6950
.6985
.7019
.7054
.7088
.7123
.7157
.7190
.7224
0.5
The area of the shaded region is 0.1312
0.6
.7257
.7291
.7324
.7357
.7389
7422
.7454
.7486
.7517
.7549
0.6
(Round to four decimal places as needed.)
0.7
.7580
.7611
.7642
.7673
.7704
.7734
.7764
.7794
.7823
.7852
0.7
0.8
.7881
.7910
.7939
.7967
.7995
.8023
.8051
.8078
.8106
.8133
0.8
0.9
.8159
.8186
.8212
.8238
.8264
.8289
.8315
.8340
.8365
.8389
0.9
1.0
.8413
.8438
.8461
.8485
.8508
.8531
.8554
.8577
.8599
.8621
1.0
1.1
.8643
.8665
.8686
.8708
.8729
.8749
.8770
.8790
.8810
.8830
1.1
1.2
.8849
.8869
.8888
.8907
.8925
.8944
.8962
.8980
.8997
.9015
1.2
1.3
.9032
.9049
.9066
.9082
.9099
.9115
.9131
.9147
.9162
.9177
1.3
1.4
.9192
.9207
.9222
.9236
.9251
.9265
.9279
.9292
.9306
.9319
1.4
1.5
.9332
.9345
.9357
.9370
.9382
.9394
.9406
.9418
.9429
.9441
1.5
1.6
.9452
.9463
.9474
.9484
.9495
.9505
.9515
.9525
.9535
.9545
1.6
1.7
.9554
.9564
.9573
.9582
.9591
.9599
.9608
.9616
.9625
.9633
1.7
1.8
9641
.9649
.9656
.9664
.9671
.9678
.9686
.9693
.9699
.9706
1.8
1.9
.9713
.9719
.9726
.9732
.9738
.9744
.9750
.9756
.9761
.9767
1.9
2.0
.9772
.9778
.9783
.9788
.9793
.9798
.9803
.9808
.9812
.9817
2.0
2.1
.9821
.9826
.9830
.9834
.9838
.9842
.9846
.9850
.9854
.9857
2.1
2.2
.9861
.9864
.9868
.9871
9875
.9878
.9881
.9884
.9887
.9890
2.2
2.3
.9893
.9896
.9898
.9901
.9904
.9906
.9909
.9911
.9913
.9916
2.3
2.4
2.5
.9918
.9920
.9922
.9925
.9927
.9929
.9931
.9932
.9934
.9936
2.4
.9938
.9953
9940
.9941
.9943
.9945
.9946
.9948
.9949
.9951
.9952
2.5
2.6
.9955
.9956
.9957
.9959
.9960
.9961
.9962
9963
.9964
2.6
2.7
.9965
.9966
.9967
.9968
.9969
.9970
.9971
.9972
.9973
.9974
2.7
0077
0077
0070
o001
Enter your answer in the answer box and then click Check Answer.
Print
Done
All parts showing
Clear All
Check Answer
3.
Expert Solution
arrow_forward
Step 1
P(z > 1.12) = 1- P(z<1.12)
= 1 - 0. 8686 (Z score at 1.12 from Normal table)
= 0.1314
Therefore area of the shaded region is 0.1314

Step by stepSolved in 2 steps with 1 images

Knowledge Booster


Learn more about
Need a deep-dive on the concept behind this application? Look no further. Learn more about this topic, statistics and related others by exploring similar questions and additional content below.Similar questions
- For the following questions, THERE IS NO NEED FOR EXPLANATION. PLEASE PROVIDE JUST THE ANSWER THANK YOU. Please DO NOT waste time on writing things to explain. Please answer in 30 mintues or else I will write a bad review. If you follow my rules and answer in less than 30 mintues then I will write a very long and wonderful review about you. ANSWER the questions correlty and please answer all the questions with what it regards in saying exactly.arrow_forwardFind area to the left of z= -1.67arrow_forwardFind the area of the following figure: 7 m 18 m O 168.22 O 145.45 136 2. 115.48arrow_forward
- Consider the following passage: I ran a regression, with many variables to predict the result of another variable which was the murder rate. One can see that lots of things, can cause the murder rate to increase or decrease. I tried to account for all the important factors, and those factors are the SAT scores, unemployment rate, and international migration per 1,000. The SAT score is, average combined total score participants did on the SAT exam. The unemployment rate is, "a measure of the prevalence of unemployment and it is calculated as a percentage by dividing the number of unemployed individuals by all individuals currently in the labor force." (Wikipedia) International migration per 1,000 is, the number of people who come into a state from other countries per 1,000 people who live in the state. After I run the regression I will look at the t scores and p values and I should hopefully conclude that international migration does not cause crime. Which writing mistakes, if any, did…arrow_forwardWhat is the area of the circle shown below? 10 cm A 25 T cm? в 10п ст? 100T cm? D 5n cm?arrow_forwardWhat is the area of a rectangle with length of 21.4 and height of 22.2? (Round to 2 decimal places as needed)arrow_forward
- Approximate, in meters, the circumference of a circle with radius = 18.6 m. (Round your answer to three decimal places.)arrow_forwardFind the area of this figure, in square feet, accurate to 3 significant digits. O +6'8" -10'4"arrow_forwardA cone-shaped paperweight is 55 inches tall, and the base has a circumference of about 12.5612.56 inches. What is the area of a vertical cross section through the center of the base of the paperweight? Use 3.143.14 for πarrow_forward
arrow_back_ios
arrow_forward_ios
Recommended textbooks for you
- MATLAB: An Introduction with ApplicationsStatisticsISBN:9781119256830Author:Amos GilatPublisher:John Wiley & Sons Inc
 Probability and Statistics for Engineering and th...StatisticsISBN:9781305251809Author:Jay L. DevorePublisher:Cengage Learning
 Statistics for The Behavioral Sciences (MindTap C...StatisticsISBN:9781305504912Author:Frederick J Gravetter, Larry B. WallnauPublisher:Cengage Learning
  Elementary Statistics: Picturing the World (7th E...StatisticsISBN:9780134683416Author:Ron Larson, Betsy FarberPublisher:PEARSON
 The Basic Practice of StatisticsStatisticsISBN:9781319042578Author:David S. Moore, William I. Notz, Michael A. FlignerPublisher:W. H. Freeman
 Introduction to the Practice of StatisticsStatisticsISBN:9781319013387Author:David S. Moore, George P. McCabe, Bruce A. CraigPublisher:W. H. Freeman
MATLAB: An Introduction with Applications
Statistics
ISBN:9781119256830
Author:Amos Gilat
Publisher:John Wiley & Sons Inc
Probability and Statistics for Engineering and th...
Statistics
ISBN:9781305251809
Author:Jay L. Devore
Publisher:Cengage Learning
Statistics for The Behavioral Sciences (MindTap C...
Statistics
ISBN:9781305504912
Author:Frederick J Gravetter, Larry B. Wallnau
Publisher:Cengage Learning
Elementary Statistics: Picturing the World (7th E...
Statistics
ISBN:9780134683416
Author:Ron Larson, Betsy Farber
Publisher:PEARSON
The Basic Practice of Statistics
Statistics
ISBN:9781319042578
Author:David S. Moore, William I. Notz, Michael A. Fligner
Publisher:W. H. Freeman
Introduction to the Practice of Statistics
Statistics
ISBN:9781319013387
Author:David S. Moore, George P. McCabe, Bruce A. Craig
Publisher:W. H. Freeman