
MATLAB: An Introduction with Applications
6th Edition
ISBN: 9781119256830
Author: Amos Gilat
Publisher: John Wiley & Sons Inc
expand_more
expand_more
format_list_bulleted
Related questions
Question
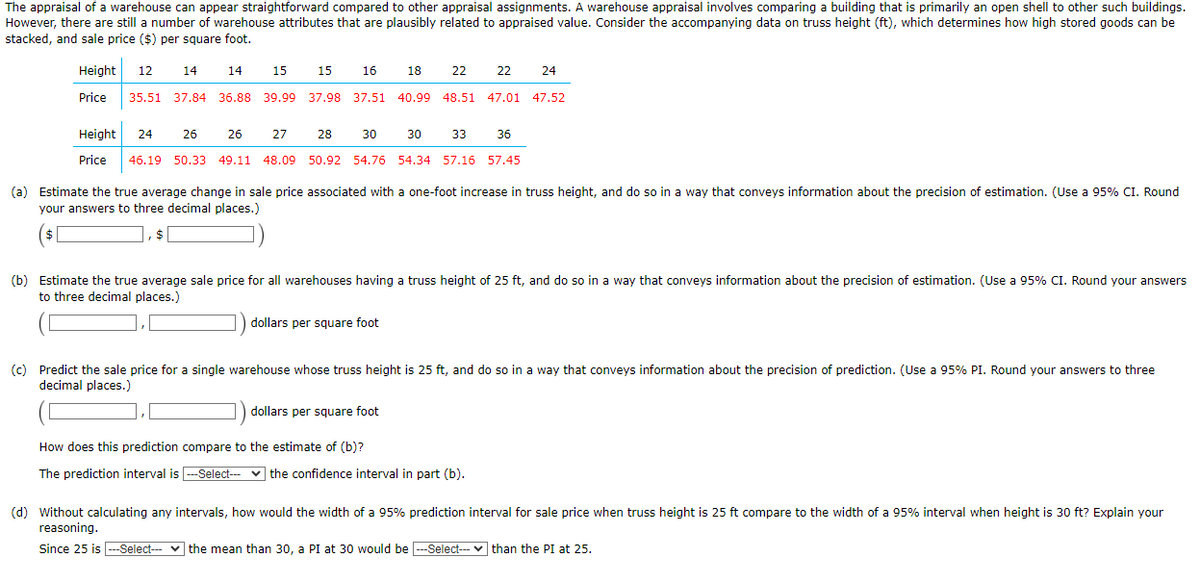

Transcribed Image Text:The appraisal of a warehouse can appear straightforward compared to other appraisal assignments. A warehouse appraisal involves comparing a building that is primarily an open shell to other such buildings.
However, there are still a number of warehouse attributes that are plausibly related to appraised value. Consider the accompanying data on truss height (ft), which determines how high stored goods can be
stacked, and sale price ($) per square foot.
Height 12
14
15
16
14
Price 35.51 37.84 36.88 39.99 37.98 37.51
15
26
28
Height 24
26
27
30
33
36
Price 46.19 50.33 49.11 48.09 50.92 54.76 54.34 57.16 57.45
18
40.99
dollars per square foot
22
48.51 47.01 47.52
30
22
dollars per square foot
(a) Estimate the true average change in sale price associated with a one-foot increase in truss height, and do so in a way that conveys information about the precision of estimation. (Use a 95% CI. Round
your answers to three decimal places.)
$
$
24
(b) Estimate the true average sale price for all warehouses having a truss height of 25 ft, and do so in a way that conveys information about the precision of estimation. (Use a 95% CI. Round your answers
to three decimal places.)
(c) Predict the sale price for a single warehouse whose truss height is 25 ft, and do so in a way that conveys information about the precision of prediction. (Use a 95% PI. Round your answers to three
decimal places.)
How does this prediction compare to the estimate of (b)?
The prediction interval is ---Select--the confidence interval in part (b).
(d) Without calculating any intervals, how would the width of a 95% prediction interval for sale price when truss height is 25 ft compare to the width of a 95% interval when height is 30 ft? Explain your
reasoning.
Since 25 is ---Select-- the mean than 30, a PI at 30 would be ---Select--- than the PI at 25.

Transcribed Image Text:(d) Without calculating any intervals, how would the width of a 95% prediction interval for sale price when truss height is 25 ft compare to the width of a 95% interval when height is 30 ft? Explain your
reasoning.
Since 25 is ---Select--- the mean than 30, a PI at 30 would be ---Select--than the PI at 25.
(e) Calculate the sample correlation coefficient. (Round your answer to three decimal places.)
Interpret the sample correlation coefficient.
There is a ---Select--- correlation between the variables.
You may need to use the appropriate table in the Appendix of Tables to answer this question.
Expert Solution
This question has been solved!
Explore an expertly crafted, step-by-step solution for a thorough understanding of key concepts.

Step by stepSolved in 4 steps

Knowledge Booster

Similar questions
- An engineer wants to determine how the weight of a gas powered car, x, affects gas mileage, y. The accompanying days represent the weights of various domestic cars and their miles per gallon in the city for the most recent model year. weight Miles per (pounds), x Gallon, y 3797 16 3897 16 2704 24 3608 20 3360 22 3040 22 3787 17 2618 24 3509 18 3798 16 3399 17 interpret the slope y-intercept, if appropriate. Choose the correct answer below for y hat = -0.00661x + 41.80 a) A weightless car will get ____ miles per gallon, on average. It is not appropriate to interpret the slope. b) for every pound added to the weight of the car, mileage in the city will…arrow_forwardThe following sales forecast was generated in Excel. What is line C? Sales Revenue $250,000 $200,000 $150,000 $100,000 $50,000 $0 1 wwwww 3 5 Multiple Choice 7 Sales Revenue пик -Forecast( Sales Revenue) Most likely predicted level of sales revenue 9 11 13 15 17 19 21 23 25 27 29 31 33 35 37 39 41 43 45 Highest predicted level of sales revenue Actual sales revenue Lowest predicted level of sales revenue A B Carrow_forwardThe data table to the right represents the volumes of a generic soda brand. Complete parts (a) and (b) below. a. Which plot represents a dotplot of the data? O A. O C. 50 60 50 70 80 90 Volumes of soda (oz) 60 70 80 90 Volumes of soda (oz) o o Q Q 520 Q Q 5 www. O B. OD. 50 50 60 70 60 Volumes of soda (oz) 70 80 75 70 65 50 元 5 75 75 85 . 70 65 Volumes of soda (oz) 80 90 70 80 90 Volumes of soda (oz) 65 80 70 Q Q Q Qarrow_forward
- What unit of analysis is reflected: "There is a relationship between unemployment rates and crime rates in a city such that cities with lower unemployment rates experience less crime."arrow_forwardSome research situations are summarized below. For each situation, identify all variables.Then, for each variable, note the level of measurement AND whether it is an independent or dependent variable. a.Ahealth researcher is interested in studying patient compliance (whether or not patients take the medicine their doctor prescribes). She surveys 800 diabetic patients, and finds compliance to be linked to patient age, education, gender, and socioeconomic status. b. A market researcher is hired by Target to see how customers buying habits have changed before and after COVID. The researcher studies how much each customer spent (in $s), how frequently they visited the website each month, how frequently they visited the store each month. They report that, since March, customers are spending less, visiting the website more frequently, and shopping in person less frequently.arrow_forwardA high school has 44 players on the football team. The summary of the players' weights is given in the box plot. Approximately, what is the percentage of players weighing greater than or equal to 245 pounds? 191 217 245 164 262 - 0o 150 160 170 180 190 200 210 220 230 240 250 260 270 00 Weight unds) Answer E Tables E Keypad Keyboard Shortcuts % Submit Answer © 2022 Hawkes Learningarrow_forward
arrow_back_ios
arrow_forward_ios
Recommended textbooks for you
- MATLAB: An Introduction with ApplicationsStatisticsISBN:9781119256830Author:Amos GilatPublisher:John Wiley & Sons Inc
 Probability and Statistics for Engineering and th...StatisticsISBN:9781305251809Author:Jay L. DevorePublisher:Cengage Learning
 Statistics for The Behavioral Sciences (MindTap C...StatisticsISBN:9781305504912Author:Frederick J Gravetter, Larry B. WallnauPublisher:Cengage Learning
  Elementary Statistics: Picturing the World (7th E...StatisticsISBN:9780134683416Author:Ron Larson, Betsy FarberPublisher:PEARSON
 The Basic Practice of StatisticsStatisticsISBN:9781319042578Author:David S. Moore, William I. Notz, Michael A. FlignerPublisher:W. H. Freeman
 Introduction to the Practice of StatisticsStatisticsISBN:9781319013387Author:David S. Moore, George P. McCabe, Bruce A. CraigPublisher:W. H. Freeman
MATLAB: An Introduction with Applications
Statistics
ISBN:9781119256830
Author:Amos Gilat
Publisher:John Wiley & Sons Inc
Probability and Statistics for Engineering and th...
Statistics
ISBN:9781305251809
Author:Jay L. Devore
Publisher:Cengage Learning
Statistics for The Behavioral Sciences (MindTap C...
Statistics
ISBN:9781305504912
Author:Frederick J Gravetter, Larry B. Wallnau
Publisher:Cengage Learning
Elementary Statistics: Picturing the World (7th E...
Statistics
ISBN:9780134683416
Author:Ron Larson, Betsy Farber
Publisher:PEARSON
The Basic Practice of Statistics
Statistics
ISBN:9781319042578
Author:David S. Moore, William I. Notz, Michael A. Fligner
Publisher:W. H. Freeman
Introduction to the Practice of Statistics
Statistics
ISBN:9781319013387
Author:David S. Moore, George P. McCabe, Bruce A. Craig
Publisher:W. H. Freeman