
MATLAB: An Introduction with Applications
6th Edition
ISBN: 9781119256830
Author: Amos Gilat
Publisher: John Wiley & Sons Inc
expand_more
expand_more
format_list_bulleted
Related questions
Concept explainers
Question
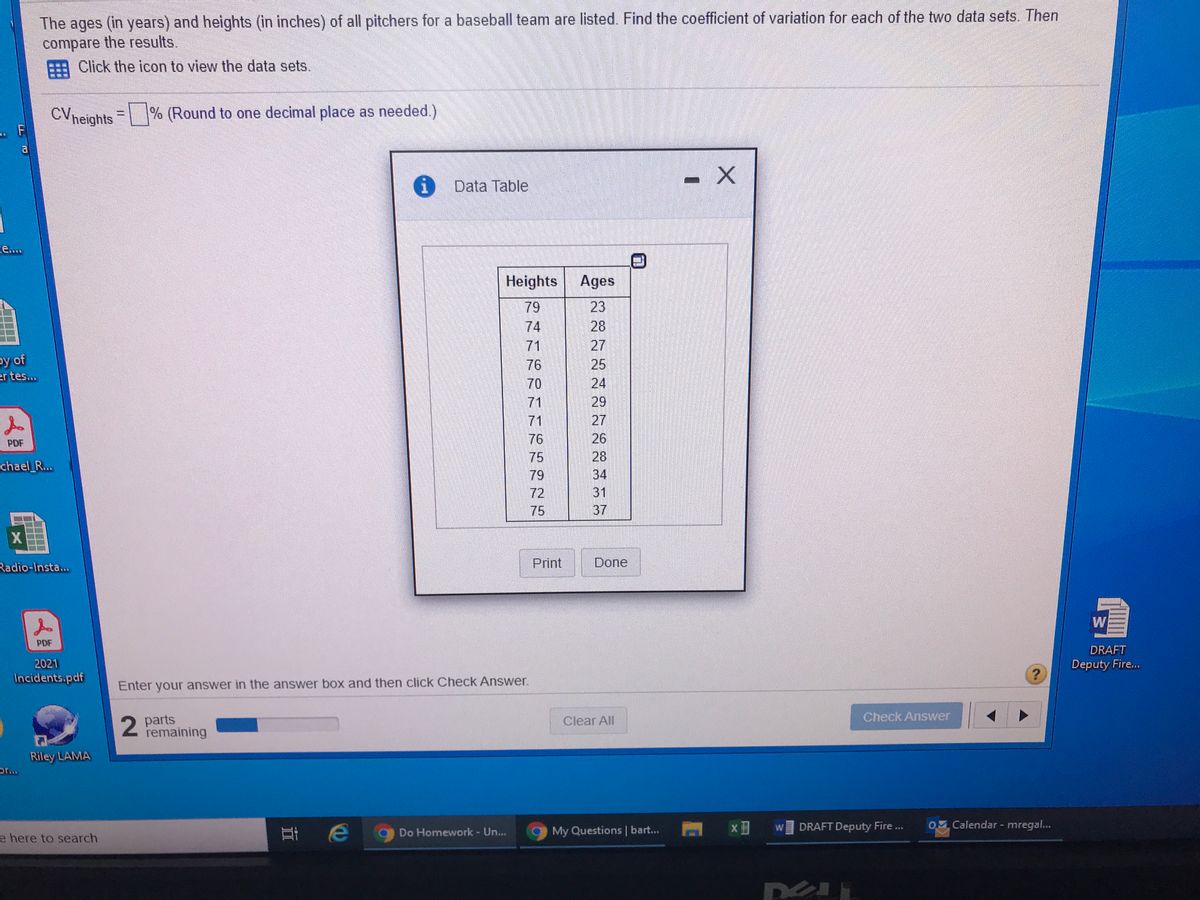

Transcribed Image Text:The ages (in years) and heights (in inches) of all pitchers for a baseball team are listed. Find the coefficient of variation for each of the two data sets. Then
compare the results.
EEA Click the icon to view the data sets.
CVneights = % (Round to one decimal place as needed.)
Data Table
e....
Heights Ages
79
23
28
27
25
24
29
74
71
by of
er tes...
76
70
71
71
27
76
26
PDF
28
34
75
chael_R...
79
72
31
75
37
X
Radio-Insta...
Print
Done
W
PDF
DRAFT
2021
Deputy Fire...
Incidents.pdf
Enter your answer in the answer box and then click Check Answer.
2 parts
remaining
Clear All
Check Answer
Riley LAMA
or..
DRAFT Deputy Fire .
0 Calendar - mregal...
耳e
W
Do Homework - Un...
9 My Questions | bart...
e here to search
Expert Solution
This question has been solved!
Explore an expertly crafted, step-by-step solution for a thorough understanding of key concepts.

This is a popular solution

Trending nowThis is a popular solution!

Step by stepSolved in 3 steps

Knowledge Booster


Learn more about
Need a deep-dive on the concept behind this application? Look no further. Learn more about this topic, statistics and related others by exploring similar questions and additional content below.Similar questions
- in image, tyarrow_forwardFind the percentile rank for each test score in the data set. Ribs to the nearest whole percentile. 5,10,15,23,26,30,35. The percentile rank for the value 5 is?arrow_forwardThe ages (in years) and heights (in inches) of all pitchers for a baseball team are listed. Find the coefficient of variation for each of the two data sets. Then compare the results. E Click the icon to view the data sets. C/neights = % (Round to one decimal place as needed.)arrow_forward
- The table gives the average monthly high and low temperatures, in degrees Fahrenheit, for a particular city over the course of a year. Find the mean and median of the low temperatures. Click here to view the monthly high and low temperatures. Monthly high and low temperatures The mean low temperature is 49.8 °F. (Type an integer or decimal rounded to the nearest tenth as needed.) Month High Low The median low temperature is°F. (Type an integer or decimal rounded to the nearest tenth as needed.) January 48 30 February 52 33 March 60 40 April 47 May 77 57 June 85 64 July 88 69 August 86 69 September 79 63 October 69 50 November 61 41arrow_forwardAssistance please, using the information from the image given below: 1. Compare the variation in the annual income for the UWI Open Campus and the annual income of New York University Explain why you chose this method to compare the variations.arrow_forwardThe first 6 months of tracking you found you spent the following amounts (rounded to the nearest whole dollar). Find the IQR of your data. Are any values outliers? 54, 65, 59, 48, 67, 60arrow_forward
- Elght students were asked how many books they read last summer. Their answers are listed below. 8, 5, 7, 5, 7, 9, 5, 5 Find the range and the mode for the data. Range: Mode:arrow_forwardA pediatrician wants to determine the relation that may exist between a child's height and head circumference. She randomly selects 8 children from her practice, measures their height and head circumference, and obtains the data shown in the table. Complete parts (a) through (e) below. Height (in.) Head Circumference (in.) O 27.25 17.5 25.25 16.9 Click here to see the Table of Critical Values for Correlation Coefficient. 26.5 17.3 25 17 28 17.6 26.25 17.2 Data Table 26.25 17.1 27.25 17.3 Critical Values for Correlation Coefficient n 3 0.997 4 0.950 0.878 0.811 7 0.754 8 0.707 0.666 10 0.632 11 0.602 12 0.576 13 0.553 14 0.532 15 0.514 16 0.497 17 0.482 18 0.468 19 0.456 20 0.444 21 0.433 22 0.423 23 0.413 24 0.404 25 0.396 26 0.388 27 0.381 28 0.374 29 0.367 30 0.361 ..... (1,1) More narrow_forwardThe ages (in years) and helghts (in inches) of all pitchers for a beseball team are listed. Find the coefficient of variation for each of the two data sets. Then compare the results. -Click the Icon to view the data sets. CV. %D Round to one decimal place as needed.)arrow_forward
- Homework: Section 2.4 Homework Save Score: 0 of 1 pt 10 of 10 (9 complete) v HW Score: 70%, 7 of 10 pts 2.4.47 Question Help The ages (in years) and heights (in inches) of all pitchers for a baseball team are listed. Find the coefficient of variation for each of the two data sets. Then compare the results. E Click the icon to view the data sets. CV neights = % (Round to one decimal place as needed.) Data Table Heights Ages 78 23 78 26 74 23 78 24 75 25 78 27 77 31 75 28 79 26 78 36 74 36 78 37 Enter your answer in the answer box and then click Che Print Done 2 parts remaining Clear All Check Answer 近arrow_forwardPlease do not give solution in image format thanku A car salesman collected data on how many cars were sold at a dealership per day for two weeks. The results were as follows: 6, 7, 4, 3, 1, 2, 6, 6, 6, 7, 4, 4. Make a frequency table and then make a histogram based on that frequency table. What is the shape of the distribution? O Skewed to the right O Skewed to the left O Bimodal O Symmetricalarrow_forwardFind the percentile for the data point. Data set: 51 33 41 72 74 75 32;data point 51arrow_forward
arrow_back_ios
SEE MORE QUESTIONS
arrow_forward_ios
Recommended textbooks for you
- MATLAB: An Introduction with ApplicationsStatisticsISBN:9781119256830Author:Amos GilatPublisher:John Wiley & Sons Inc
 Probability and Statistics for Engineering and th...StatisticsISBN:9781305251809Author:Jay L. DevorePublisher:Cengage Learning
 Statistics for The Behavioral Sciences (MindTap C...StatisticsISBN:9781305504912Author:Frederick J Gravetter, Larry B. WallnauPublisher:Cengage Learning
  Elementary Statistics: Picturing the World (7th E...StatisticsISBN:9780134683416Author:Ron Larson, Betsy FarberPublisher:PEARSON
 The Basic Practice of StatisticsStatisticsISBN:9781319042578Author:David S. Moore, William I. Notz, Michael A. FlignerPublisher:W. H. Freeman
 Introduction to the Practice of StatisticsStatisticsISBN:9781319013387Author:David S. Moore, George P. McCabe, Bruce A. CraigPublisher:W. H. Freeman
MATLAB: An Introduction with Applications
Statistics
ISBN:9781119256830
Author:Amos Gilat
Publisher:John Wiley & Sons Inc
Probability and Statistics for Engineering and th...
Statistics
ISBN:9781305251809
Author:Jay L. Devore
Publisher:Cengage Learning
Statistics for The Behavioral Sciences (MindTap C...
Statistics
ISBN:9781305504912
Author:Frederick J Gravetter, Larry B. Wallnau
Publisher:Cengage Learning
Elementary Statistics: Picturing the World (7th E...
Statistics
ISBN:9780134683416
Author:Ron Larson, Betsy Farber
Publisher:PEARSON
The Basic Practice of Statistics
Statistics
ISBN:9781319042578
Author:David S. Moore, William I. Notz, Michael A. Fligner
Publisher:W. H. Freeman
Introduction to the Practice of Statistics
Statistics
ISBN:9781319013387
Author:David S. Moore, George P. McCabe, Bruce A. Craig
Publisher:W. H. Freeman