MATLAB: An Introduction with Applications
6th Edition
ISBN: 9781119256830
Author: Amos Gilat
Publisher: John Wiley & Sons Inc
expand_more
expand_more
format_list_bulleted
Question

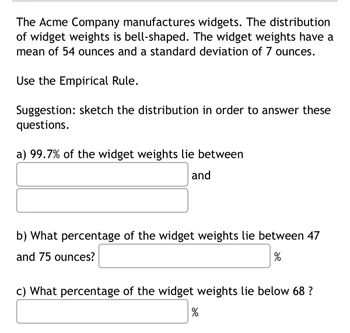
Transcribed Image Text:The Acme Company manufactures widgets. The distribution
of widget weights is bell-shaped. The widget weights have a
mean of 54 ounces and a standard deviation of 7 ounces.
Use the Empirical Rule.
Suggestion: sketch the distribution in order to answer these
questions.
a) 99.7% of the widget weights lie between
and
b) What percentage of the widget weights lie between 47
and 75 ounces?
%
c) What percentage of the widget weights lie below 68 ?
%
20
Expert Solution
This question has been solved!
Explore an expertly crafted, step-by-step solution for a thorough understanding of key concepts.
Step by stepSolved in 6 steps with 5 images

Knowledge Booster
Similar questions
- Internet Service Providers The amount that households pay service providers for access to the Internet varies quite a bit, but the mean monthly fee is $50 and the standard deviation is $20. The distribution is not Normal: many households pay a low rate as part of a bundle with phone or television service, but some pay much more for Internet only or for faster connections. A sample survey asks an SRS of 50 households with Internet access how much they pay. Let x be the mean amount paid. 1. Explain why you can't determine the probability that the amount a randomly selected household pays for access to the Internet exceeds $55. 2. What are the mean and standard deviation of the sampling distribution of x ? 3. What is the shape of the sampling distribution of x ? Justify your answer. 4. Find the probability that the average fee paid by the sample of households exceeds $55.arrow_forwardPlease helparrow_forwardUse the grouped data formulas to find the indicated mean or standard deviation. For the following data set, approximate the sample standard deviation. Height (in inches) Frequency 50-52 53-55 56-58 12 59-61 13 62-64 11 Earrow_forward
- the table below shows the number of books the Jefferson Middle school students readeach month for nine months. Month Sept. Oct. Nov. Dec. Jan. Feb. Mar. Apr. May Number of Books 293 280 266 280 289 279 275 296 271 If the students read only 101 books for the month of June, which measure of central tendency will have the greatest change?A. The mean will have the greatest change.B. The median will have the greatest change.C. All measures will have an equal change.D. The mode will have the greatest change.arrow_forwardSubject: algberaarrow_forwardThe heights of Crepe Myrtle saplings at a local nursery are measured and the data recorded. The data is then plotted and the distribution is found to be bell-shaped. The mean of the set is 67 inches and the standard deviation is 3 inches. A graph of the situation is shown below: 58 61 64 67 70 73 76 a) What percentage of the saplings is more than 70 inches tall? b) What percentage of the saplings is between 61 and 73 inches tall?arrow_forward
- Assume the selling prices of homes in a particular community follow a normal distribution with a mean of $263,100 and a standard deviation of $43,200. Complete parts a through c. a. Determine the range of selling prices in this community that includes one standard deviation around the mean. The range is from $ to $ (Type integers or decimals. Use ascending order.) b. Determine the range of selling prices in this community that includes two standard deviations around the mean. The range is from $ to $ (Type integers or decimals. Use ascending order.) c. Determine the range of selling prices in this community that includes three standard deviations around the mean. The range is from $ to $1. (Type integers or decimals. Use ascending order.)arrow_forwardPlease answer a and barrow_forwardMilanarrow_forward
- Jse the Empirical Rule. The mean speed of a sample of vehicles along a stretch of highway is 64 miles per hour, with a standard deviation of 4 miles per hour. Estimate the percent of vehicles whose speeds are between miles per hour and 72 miles per hour. (Assume the data set has a bell-shaped distribution.) Approximately % of vehicles travel between 56 miles per hour and 72 miles per hour.arrow_forward❎❎❎❎✅✅✅✅✅✅✅arrow_forwardNo calculations required. Choose correct answer only.arrow_forward
arrow_back_ios
SEE MORE QUESTIONS
arrow_forward_ios
Recommended textbooks for you
 MATLAB: An Introduction with ApplicationsStatisticsISBN:9781119256830Author:Amos GilatPublisher:John Wiley & Sons Inc
 Probability and Statistics for Engineering and th...StatisticsISBN:9781305251809Author:Jay L. DevorePublisher:Cengage Learning
 Statistics for The Behavioral Sciences (MindTap C...StatisticsISBN:9781305504912Author:Frederick J Gravetter, Larry B. WallnauPublisher:Cengage Learning
 Elementary Statistics: Picturing the World (7th E...StatisticsISBN:9780134683416Author:Ron Larson, Betsy FarberPublisher:PEARSON
 The Basic Practice of StatisticsStatisticsISBN:9781319042578Author:David S. Moore, William I. Notz, Michael A. FlignerPublisher:W. H. Freeman
 Introduction to the Practice of StatisticsStatisticsISBN:9781319013387Author:David S. Moore, George P. McCabe, Bruce A. CraigPublisher:W. H. Freeman

MATLAB: An Introduction with Applications
Statistics
ISBN:9781119256830
Author:Amos Gilat
Publisher:John Wiley & Sons Inc

Probability and Statistics for Engineering and th...
Statistics
ISBN:9781305251809
Author:Jay L. Devore
Publisher:Cengage Learning

Statistics for The Behavioral Sciences (MindTap C...
Statistics
ISBN:9781305504912
Author:Frederick J Gravetter, Larry B. Wallnau
Publisher:Cengage Learning

Elementary Statistics: Picturing the World (7th E...
Statistics
ISBN:9780134683416
Author:Ron Larson, Betsy Farber
Publisher:PEARSON

The Basic Practice of Statistics
Statistics
ISBN:9781319042578
Author:David S. Moore, William I. Notz, Michael A. Fligner
Publisher:W. H. Freeman

Introduction to the Practice of Statistics
Statistics
ISBN:9781319013387
Author:David S. Moore, George P. McCabe, Bruce A. Craig
Publisher:W. H. Freeman