MATLAB: An Introduction with Applications
6th Edition
ISBN: 9781119256830
Author: Amos Gilat
Publisher: John Wiley & Sons Inc
expand_more
expand_more
format_list_bulleted
Concept explainers
Question

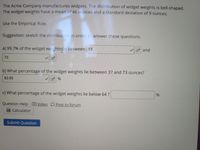
Transcribed Image Text:The Acme Company manufactures widgets. The distribution of widget weights is bell-shaped.
The widget weights have a mean of 46 ounces and a standard deviation of 9 ounces.
Use the Empirical Rule.
Suggestion: sketch the distribution in order tc answer these questions.
a) 99.7% of the widget weightsTiie between 19
f and
73
b) What percentage of the widget weights lie between 37 and 73 ounces?
83.85
c) What percentage of the widget weights lie below 64 ?
Question Help: DVideo D Post to forum
Calculator
Submit Question
Expert Solution
This question has been solved!
Explore an expertly crafted, step-by-step solution for a thorough understanding of key concepts.
This is a popular solution
Trending nowThis is a popular solution!
Step by stepSolved in 2 steps

Knowledge Booster
Learn more about
Need a deep-dive on the concept behind this application? Look no further. Learn more about this topic, statistics and related others by exploring similar questions and additional content below.Similar questions
- please answer the question in the photo. Thank youarrow_forwardPlease see attachmentarrow_forwardA company produces steel rods. The lengths of the steel rods are normally distributed with a mean of 136 cm and a standard deviation of 1.2 cm.. Find Pos, which is the length separating the shortest 95% rods from the longest 5%. Round your answer to at least one decimal place.arrow_forward
- Jse the Empirical Rule. The mean speed of a sample of vehicles along a stretch of highway is 64 miles per hour, with a standard deviation of 4 miles per hour. Estimate the percent of vehicles whose speeds are between miles per hour and 72 miles per hour. (Assume the data set has a bell-shaped distribution.) Approximately % of vehicles travel between 56 miles per hour and 72 miles per hour.arrow_forwardThe highway mileage (mpg) for a sample of 8 different models of a car company can be found below. Find the mean, median, mode, and standard deviation. Round to one decimal place as needed. Use technology.20, 22, 26, 27, 29, 32, 33, 33Mean = Median = Mode = Standard Deviation =arrow_forwardAdult men have an average height of 69.0 inches with a standard deviation of 2.8 inches. Find the height of a man with a z-score of 0.07. Round your answer to one decimal place. inchesarrow_forward
- A particular fruit's weights are normally distributed, with a mean of 334 grams and a standard deviation of 6 grams. The heaviest 11% of fruits weigh more than how many grams? Give your answer to the nearest gram. Check Answerarrow_forwardA survey collected the data below. x 26 4 16 12 20 The mean is 15.6. Calculate the deviation of x=16 ?arrow_forwardA population of adults males heights distributed as approximately normal with mean 69 inches and a standard deviation of 3.5 inches. Ralph is 5 feet and 7 inches tall (67 inches). What proportion of the population is taller than he?arrow_forward
- A successful basketball player has a height of 6 feet 11 inches, or 211 cm. Based on statistics from a data set, his height converts to the z score of 5.17. How many standard deviations is his height above the mean?arrow_forwardThe highway mileage (mpg) for a sample of 8 different models of a car company can be found below. Find the mean, median, mode, and standard deviation. Round to one decimal place as needed. 20, 23, 25, 28, 30, 32, 33, 33 Mean = Median = Mode = Standard Deviation =arrow_forwardIdentify the parameter(s). Whether or not a person consumes alcohol. The population mean amount of alcohol consumed by each person per year. all individuals who consume alcohol. The population proportion of those who consume alcohol. info: The average American consumes 100 liters of alcohol per year. Does the average college student consume less alcohol per year? A researcher surveyed 13 randomly selected college students and found that they averaged 85.7 liters of alcohol consumed per year with a standard deviation of 21 liters.arrow_forward
arrow_back_ios
SEE MORE QUESTIONS
arrow_forward_ios
Recommended textbooks for you
 MATLAB: An Introduction with ApplicationsStatisticsISBN:9781119256830Author:Amos GilatPublisher:John Wiley & Sons Inc
 Probability and Statistics for Engineering and th...StatisticsISBN:9781305251809Author:Jay L. DevorePublisher:Cengage Learning
 Statistics for The Behavioral Sciences (MindTap C...StatisticsISBN:9781305504912Author:Frederick J Gravetter, Larry B. WallnauPublisher:Cengage Learning
 Elementary Statistics: Picturing the World (7th E...StatisticsISBN:9780134683416Author:Ron Larson, Betsy FarberPublisher:PEARSON
 The Basic Practice of StatisticsStatisticsISBN:9781319042578Author:David S. Moore, William I. Notz, Michael A. FlignerPublisher:W. H. Freeman
 Introduction to the Practice of StatisticsStatisticsISBN:9781319013387Author:David S. Moore, George P. McCabe, Bruce A. CraigPublisher:W. H. Freeman

MATLAB: An Introduction with Applications
Statistics
ISBN:9781119256830
Author:Amos Gilat
Publisher:John Wiley & Sons Inc

Probability and Statistics for Engineering and th...
Statistics
ISBN:9781305251809
Author:Jay L. Devore
Publisher:Cengage Learning

Statistics for The Behavioral Sciences (MindTap C...
Statistics
ISBN:9781305504912
Author:Frederick J Gravetter, Larry B. Wallnau
Publisher:Cengage Learning

Elementary Statistics: Picturing the World (7th E...
Statistics
ISBN:9780134683416
Author:Ron Larson, Betsy Farber
Publisher:PEARSON

The Basic Practice of Statistics
Statistics
ISBN:9781319042578
Author:David S. Moore, William I. Notz, Michael A. Fligner
Publisher:W. H. Freeman

Introduction to the Practice of Statistics
Statistics
ISBN:9781319013387
Author:David S. Moore, George P. McCabe, Bruce A. Craig
Publisher:W. H. Freeman