
MATLAB: An Introduction with Applications
6th Edition
ISBN: 9781119256830
Author: Amos Gilat
Publisher: John Wiley & Sons Inc
expand_more
expand_more
format_list_bulleted
Related questions
Question

Transcribed Image Text:Š
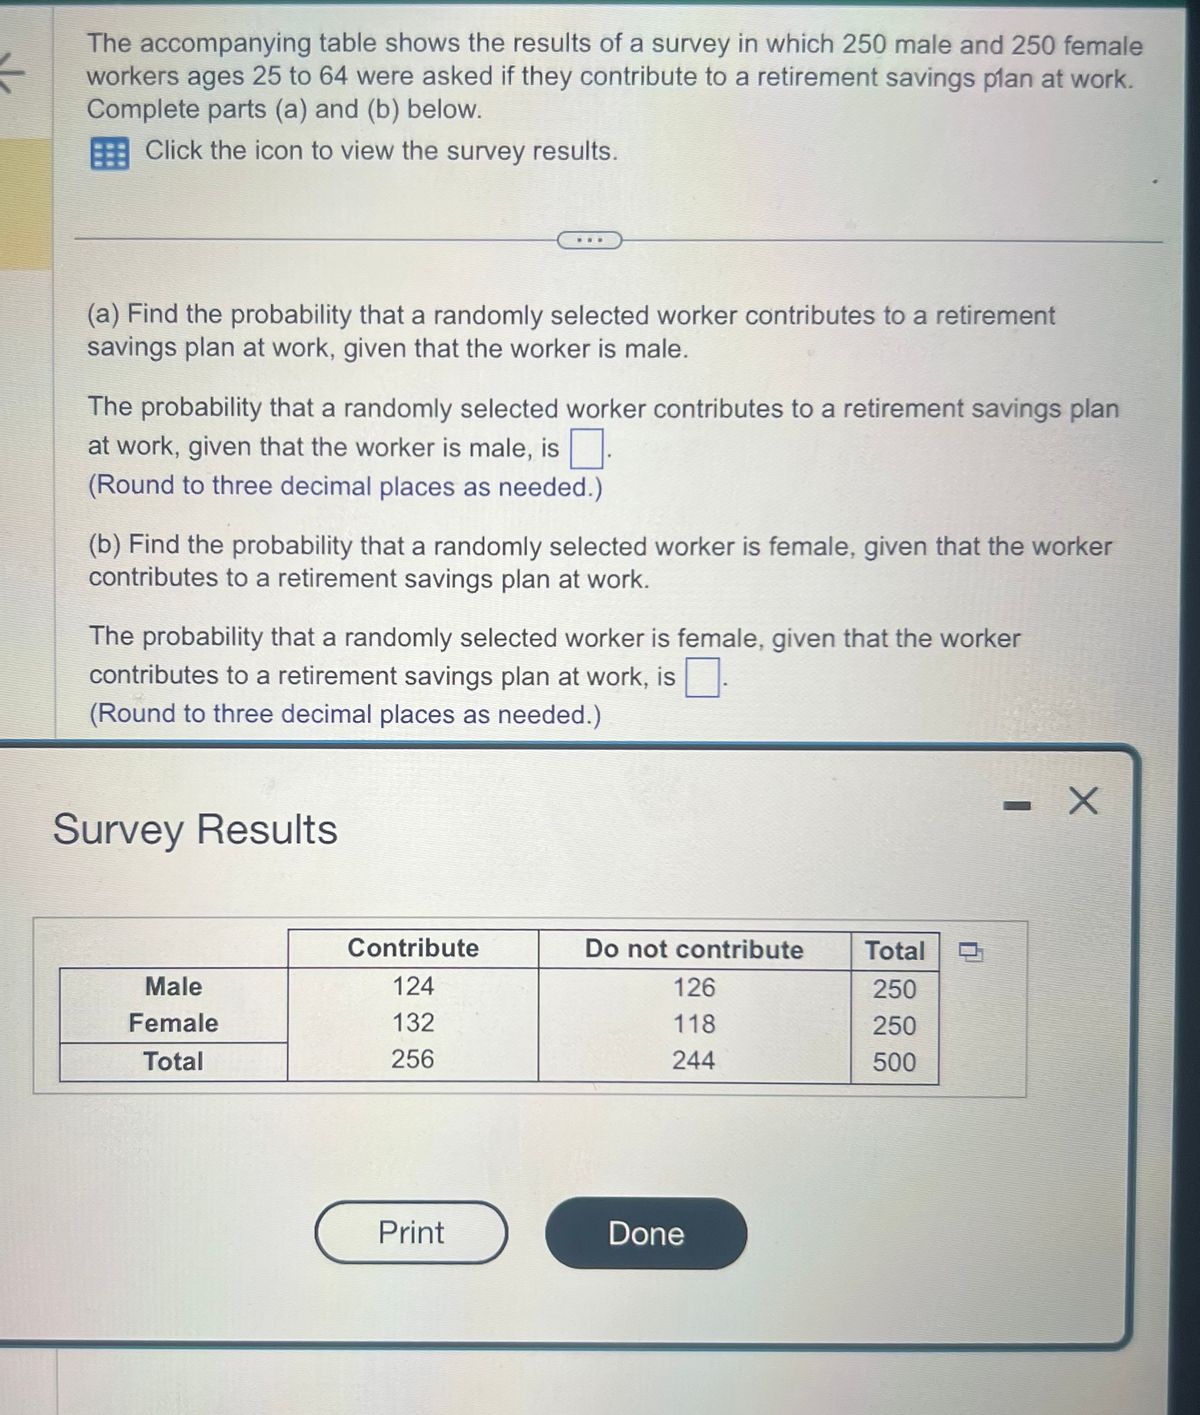
The accompanying table shows the results of a survey in which 250 male and 250 female
workers ages 25 to 64 were asked if they contribute to a retirement savings plan at work.
Complete parts (a) and (b) below.
Click the icon to view the survey results.
(a) Find the probability that a randomly selected worker contributes to a retirement
savings plan at work, given that the worker is male.
The probability that a randomly selected worker contributes to a retirement savings plan
at work, given that the worker is male, is.
(Round to three decimal places as needed.)
(b) Find the probability that a randomly selected worker is female, given that the worker
contributes to a retirement savings plan at work.
The probability that a randomly selected worker is female, given that the worker
contributes to a retirement savings plan at work, is
(Round to three decimal places as needed.)
Survey Results
Male
Female
Total
Contribute
124
132
256
Print
Do not contribute
126
118
244
Done
Total
250
250
500
- X
L
Expert Solution
This question has been solved!
Explore an expertly crafted, step-by-step solution for a thorough understanding of key concepts.

This is a popular solution

Trending nowThis is a popular solution!

Step by stepSolved in 3 steps

Knowledge Booster

Similar questions
- A 10-year study conducted by the American Heart Association provided data on how age, blood pressure, and smoking relate to the risk of strokes. Data from a portion of this study are contained in the Excel Online file below. Risk is interpreted as the probability (times 100) that a person will have a stroke over the next 10-year period. For the smoker variable, 1 indicates a smoker and 0 indicates a nonsmoker. Construct a spreadsheet to answer the following questions.arrow_forwardThe percentages of weapons used in murders in a certain year are described in the pie chart. Complete parts (a) through (c) below. Types of Weapons Used in Murders Fireams, 64.9% Knives or other cutting instruments, 10.2% Unknown or other dangerous weapon, 13.1% Personal weapons (hands, fists, etc), 11.8% a. Find the probability that a weapon randomly selected from those used in murders in this specific year was a firearm. The probability that a weapon randomly selected from those used in murders in this specific year was a firearm is Type an integer or a decimal.) b. Find the probability that a weapon randomly selected from those used in murders in this specific year was NOT a firearm The probability that a weapon randomly selected from those used in murders in this specific year was NOT a firearm is (Type an integer or a decimal.) c. From inspecting the pie chart, a student concludes that in any year, 11.8% of weapons used in murders are personal weapons What would you tell the…arrow_forwardAssume that when adults with smartphones are randomly selected, 35% use them in meetings or classes. If 9 adult smartphone users are randomly selected, find the probability that exactly 4 of them use their smartphones in meetings or classes.arrow_forward
- At a bakery, a customer with a purchase amount of under $20 has a probability of 0.35 of using a credit card for the purchase, while a customer with a purchase amount of $20 or over has a probability of 0.6 of using a credit card for the purchase. Data shows that 80 % of purchases at the bakery are under $20. Given that a customer uses a credit card for a purchase, find the probability that the purchase amount was $20 or over. Give the probability as a decimal, and if rounding give to 4 decimal places.arrow_forwardA survey of U.S. adults ages 18-29 found that 92% use the internet. You randomly select 100 adults ages 18-29 and ask them if they use the internet. The probability that at least 86 people say they use the internet is [ ].arrow_forwardThe table below shows the results of a survey about a junk food tax. Support Oppose Unsure Male 116 370 14 Female 289 389 25 A person is selected at random from the sample. What is the probability that the person is male and supports the tax? Your answer should be a decimal (not a percent) correct to three decimal places.arrow_forward
- The accompanying table shows the numbers of male and female students in a particular country who received bachelor's degrees in business in a recent year. Complete parts (a) and (b) below. E Click the icon to view the data on business degrees. ..... (a) Find the probability that a randomly selected student is male, given that the student received a business degree. The probability that a randomly selected student is male, given that the student received a business degree, is (Round to three decimal places as needed.) Business Graduates (b) Find the probability that a randomly selected student received a business degree, given that the student is female. The probability that a randomly selected student received a business degree, given that the student is female, is (Round to three decimal places as needed.) Business degrees Nonbusiness degrees Total Male 199,313 600,822 800,135 1,065,757 1,865,892 Female 177,694 888,063 Total 377,007 1,488,885 Print Donearrow_forwardUse the standard normal probability chart, included in this exam, to look up the following numbers and draw the graph for each one. a. - .0492 b. 1.6 c. 1.06 d. -5.2arrow_forwardQuestion content area top left Part 1 Use the accompanying bar graph, which shows the highest level of education received by employees of a company, to find the probability that the highest level of education for an employee chosen at random is a doctoratea doctorate. ... Question content area top right Part 1 A bar graph titled Level of Education has a horizontal axis labeled Doctoral, Master's, Bachelor's, Associate's, High School diploma, and Other and a vertical axis labeled Number of employees from 0 to 40 in increments of 5. There are vertical bars, each of which is over a horizontal axis label. The heights of the bars are as follows, where the horizontal axis label is listed first and the height is listed second: Doctoral, 2; Master's, 25; Bachelor's, 32; Associate's, 24; High School diploma, 4; Other, 1. Each bar is labeled with its height. Level of education ABCDEF010203040Number of employeesA:DoctoralB:Master'sC:Bachelor'sD:Associate'sE:High School…arrow_forward
- The table shows the distribution, by age and gender, of the 28.5 million people in a certain region who live alone. Use the data in the table to find the probability that a randomly selected person in the region is a woman in the 18-24 age range living alone. Male Female Total Attempted Ages Ages Ages Ages Ages Ages 18-24 25-34 35-44 45-64 65-74 275 Total 0.9 2.3 2.4 0.7 1.5 1.2 1.6 3.8 3.6 4.6 1.4 1.5 4.8 6.3 5.0 2.2 9.6 3.6 BECER 13.1 15.4 28.5 The probability is (Type an integer or decimal rounded to the nearest hundredth as needed.)arrow_forwardAssume that when adults with smartphones are randomly selected, 57% use them in meetings or classes. If 30 adult smartphone users are randomly selected, find the probability that exactly 24 of them use their smartphones in meetings or classes.arrow_forwardTake a case of tossing of 20 coins. Draw a probability distribution of all the exhaustive events possible in the case. Use excel for calculations and plotting.arrow_forward
arrow_back_ios
SEE MORE QUESTIONS
arrow_forward_ios
Recommended textbooks for you
- MATLAB: An Introduction with ApplicationsStatisticsISBN:9781119256830Author:Amos GilatPublisher:John Wiley & Sons Inc
 Probability and Statistics for Engineering and th...StatisticsISBN:9781305251809Author:Jay L. DevorePublisher:Cengage Learning
 Statistics for The Behavioral Sciences (MindTap C...StatisticsISBN:9781305504912Author:Frederick J Gravetter, Larry B. WallnauPublisher:Cengage Learning
  Elementary Statistics: Picturing the World (7th E...StatisticsISBN:9780134683416Author:Ron Larson, Betsy FarberPublisher:PEARSON
 The Basic Practice of StatisticsStatisticsISBN:9781319042578Author:David S. Moore, William I. Notz, Michael A. FlignerPublisher:W. H. Freeman
 Introduction to the Practice of StatisticsStatisticsISBN:9781319013387Author:David S. Moore, George P. McCabe, Bruce A. CraigPublisher:W. H. Freeman
MATLAB: An Introduction with Applications
Statistics
ISBN:9781119256830
Author:Amos Gilat
Publisher:John Wiley & Sons Inc
Probability and Statistics for Engineering and th...
Statistics
ISBN:9781305251809
Author:Jay L. Devore
Publisher:Cengage Learning
Statistics for The Behavioral Sciences (MindTap C...
Statistics
ISBN:9781305504912
Author:Frederick J Gravetter, Larry B. Wallnau
Publisher:Cengage Learning
Elementary Statistics: Picturing the World (7th E...
Statistics
ISBN:9780134683416
Author:Ron Larson, Betsy Farber
Publisher:PEARSON
The Basic Practice of Statistics
Statistics
ISBN:9781319042578
Author:David S. Moore, William I. Notz, Michael A. Fligner
Publisher:W. H. Freeman
Introduction to the Practice of Statistics
Statistics
ISBN:9781319013387
Author:David S. Moore, George P. McCabe, Bruce A. Craig
Publisher:W. H. Freeman