MATLAB: An Introduction with Applications
6th Edition
ISBN: 9781119256830
Author: Amos Gilat
Publisher: John Wiley & Sons Inc
expand_more
expand_more
format_list_bulleted
Question
thumb_up100%
Part b?
Find the equation of best fit line.

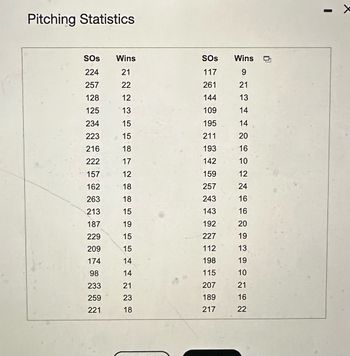
Transcribed Image Text:Pitching Statistics
SOS
Wins
SOS Wins
224
21
117
257
22
261
128
12
144
125
13
109
1271
9
21
13
14
234
15
195
14
223
15
211
20
20
216
18
193
16
222
17
142
10
157
12
159
12
162
18
257
24
263
18
243
16
213
15
143
16
187
19
192
20
229
15
227
19
209
15
112
13
174
14
198
19
98
14
115
10
233
21
207
21
259
23
189
16
221
18
217
22

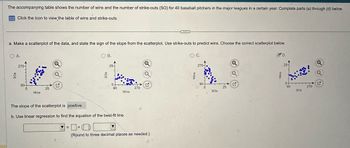
Transcribed Image Text:The accompanying table shows the number of wins and the number of strike-outs (SO) for 40 baseball pitchers in the major leagues in a certain year. Complete parts (a) through (d) below.
Click the icon to view the table of wins and strike-outs.
a. Make a scatterplot of the data, and state the sign of the slope from the scatterplot. Use strike-outs to predict wins. Choose the correct scatterplot below.
○ A.
270-
90-
5
Wins
25
The slope of the scatterplot is positive.
B.
Q
25-
Oc.
270-
D.
Q
25-
Q
G
90-
90
270
25
90
270
Wins
SOs
SOs
b. Use linear regression to find the equation of the best-fit line.
☐ +
(Round to three decimal places as needed.)
Expert Solution
This question has been solved!
Explore an expertly crafted, step-by-step solution for a thorough understanding of key concepts.
Step by stepSolved in 2 steps

Knowledge Booster
Similar questions
- 17. THE DINNER BANQUET Reese and Markus are planning a special party for their family and friends. A local restaurant offers dinner banquets at $360 for the first 15 guests and $27.50 per person for additional guests. There is a minimum of 15 guests required to reserve the banquet room. a. Assume that at least 15 guests will attend. Write an equation for the cost of the banquet in terms of the number of guests. b. If Reese and Markus want to keep costs below $750, how many guests should they invite?arrow_forward4. A retailer imports a crate of sunglasses for $3800. There are x amount of pairs of glasses in the box. 8 pairs of glasses are defective and can't be sold. The retailer sells the remaining sunglasses for $4800, realizing a profit of $6 per pair. Write the equation that represents this scenario.arrow_forwardHello! I need help on this question on my study guide. Thank you, and appreciate the help!arrow_forward
- 4. Look For Relationships You are solving an equation with a variable on each side. Does the side on which you choose to isolate the variable affect the solution? Why might you choose one side over the other?arrow_forwardFind the x and y intercepts (written as a point)arrow_forwardThe value of a new computer is $1400. Two years later the computer is worth $1100. 29. Write the linear equation that fits these data points. 30. Use the equation to predict the value of the computer after 5 years. Review. 31. Factor: 10x + 13x - 3 IDx+15x-Zx-3 32. Factor: 2m + 3m2- 18m- 27 mz(Zm+3)-9(2m+3)arrow_forward
- 27. See photoarrow_forwardInterpret the direction and strength of the scatterplots below. Explain your answer.arrow_forwardBClasswork for (CD) Math 8 -Mt. E Edulastic Meet - bmg-wbfz-hqf A app.edulastic.com/student/assessment/6036fd9313b8bf0008ac3627/class/5f8e11b E· Question 2/10 NEXT A BOOKMARK Which equation represents the line shown on the coordinate grid below? 10 8. 6. 4. (5, 0) -10 -8 -6 -4 24 -2 -2 (0, -2) 6 8. 10 -4 9- 8- 10 2.arrow_forward
arrow_back_ios
arrow_forward_ios
Recommended textbooks for you
 MATLAB: An Introduction with ApplicationsStatisticsISBN:9781119256830Author:Amos GilatPublisher:John Wiley & Sons Inc
 Probability and Statistics for Engineering and th...StatisticsISBN:9781305251809Author:Jay L. DevorePublisher:Cengage Learning
 Statistics for The Behavioral Sciences (MindTap C...StatisticsISBN:9781305504912Author:Frederick J Gravetter, Larry B. WallnauPublisher:Cengage Learning
 Elementary Statistics: Picturing the World (7th E...StatisticsISBN:9780134683416Author:Ron Larson, Betsy FarberPublisher:PEARSON
 The Basic Practice of StatisticsStatisticsISBN:9781319042578Author:David S. Moore, William I. Notz, Michael A. FlignerPublisher:W. H. Freeman
 Introduction to the Practice of StatisticsStatisticsISBN:9781319013387Author:David S. Moore, George P. McCabe, Bruce A. CraigPublisher:W. H. Freeman

MATLAB: An Introduction with Applications
Statistics
ISBN:9781119256830
Author:Amos Gilat
Publisher:John Wiley & Sons Inc

Probability and Statistics for Engineering and th...
Statistics
ISBN:9781305251809
Author:Jay L. Devore
Publisher:Cengage Learning

Statistics for The Behavioral Sciences (MindTap C...
Statistics
ISBN:9781305504912
Author:Frederick J Gravetter, Larry B. Wallnau
Publisher:Cengage Learning

Elementary Statistics: Picturing the World (7th E...
Statistics
ISBN:9780134683416
Author:Ron Larson, Betsy Farber
Publisher:PEARSON

The Basic Practice of Statistics
Statistics
ISBN:9781319042578
Author:David S. Moore, William I. Notz, Michael A. Fligner
Publisher:W. H. Freeman

Introduction to the Practice of Statistics
Statistics
ISBN:9781319013387
Author:David S. Moore, George P. McCabe, Bruce A. Craig
Publisher:W. H. Freeman