
MATLAB: An Introduction with Applications
6th Edition
ISBN: 9781119256830
Author: Amos Gilat
Publisher: John Wiley & Sons Inc
expand_more
expand_more
format_list_bulleted
Related questions
Concept explainers
Question
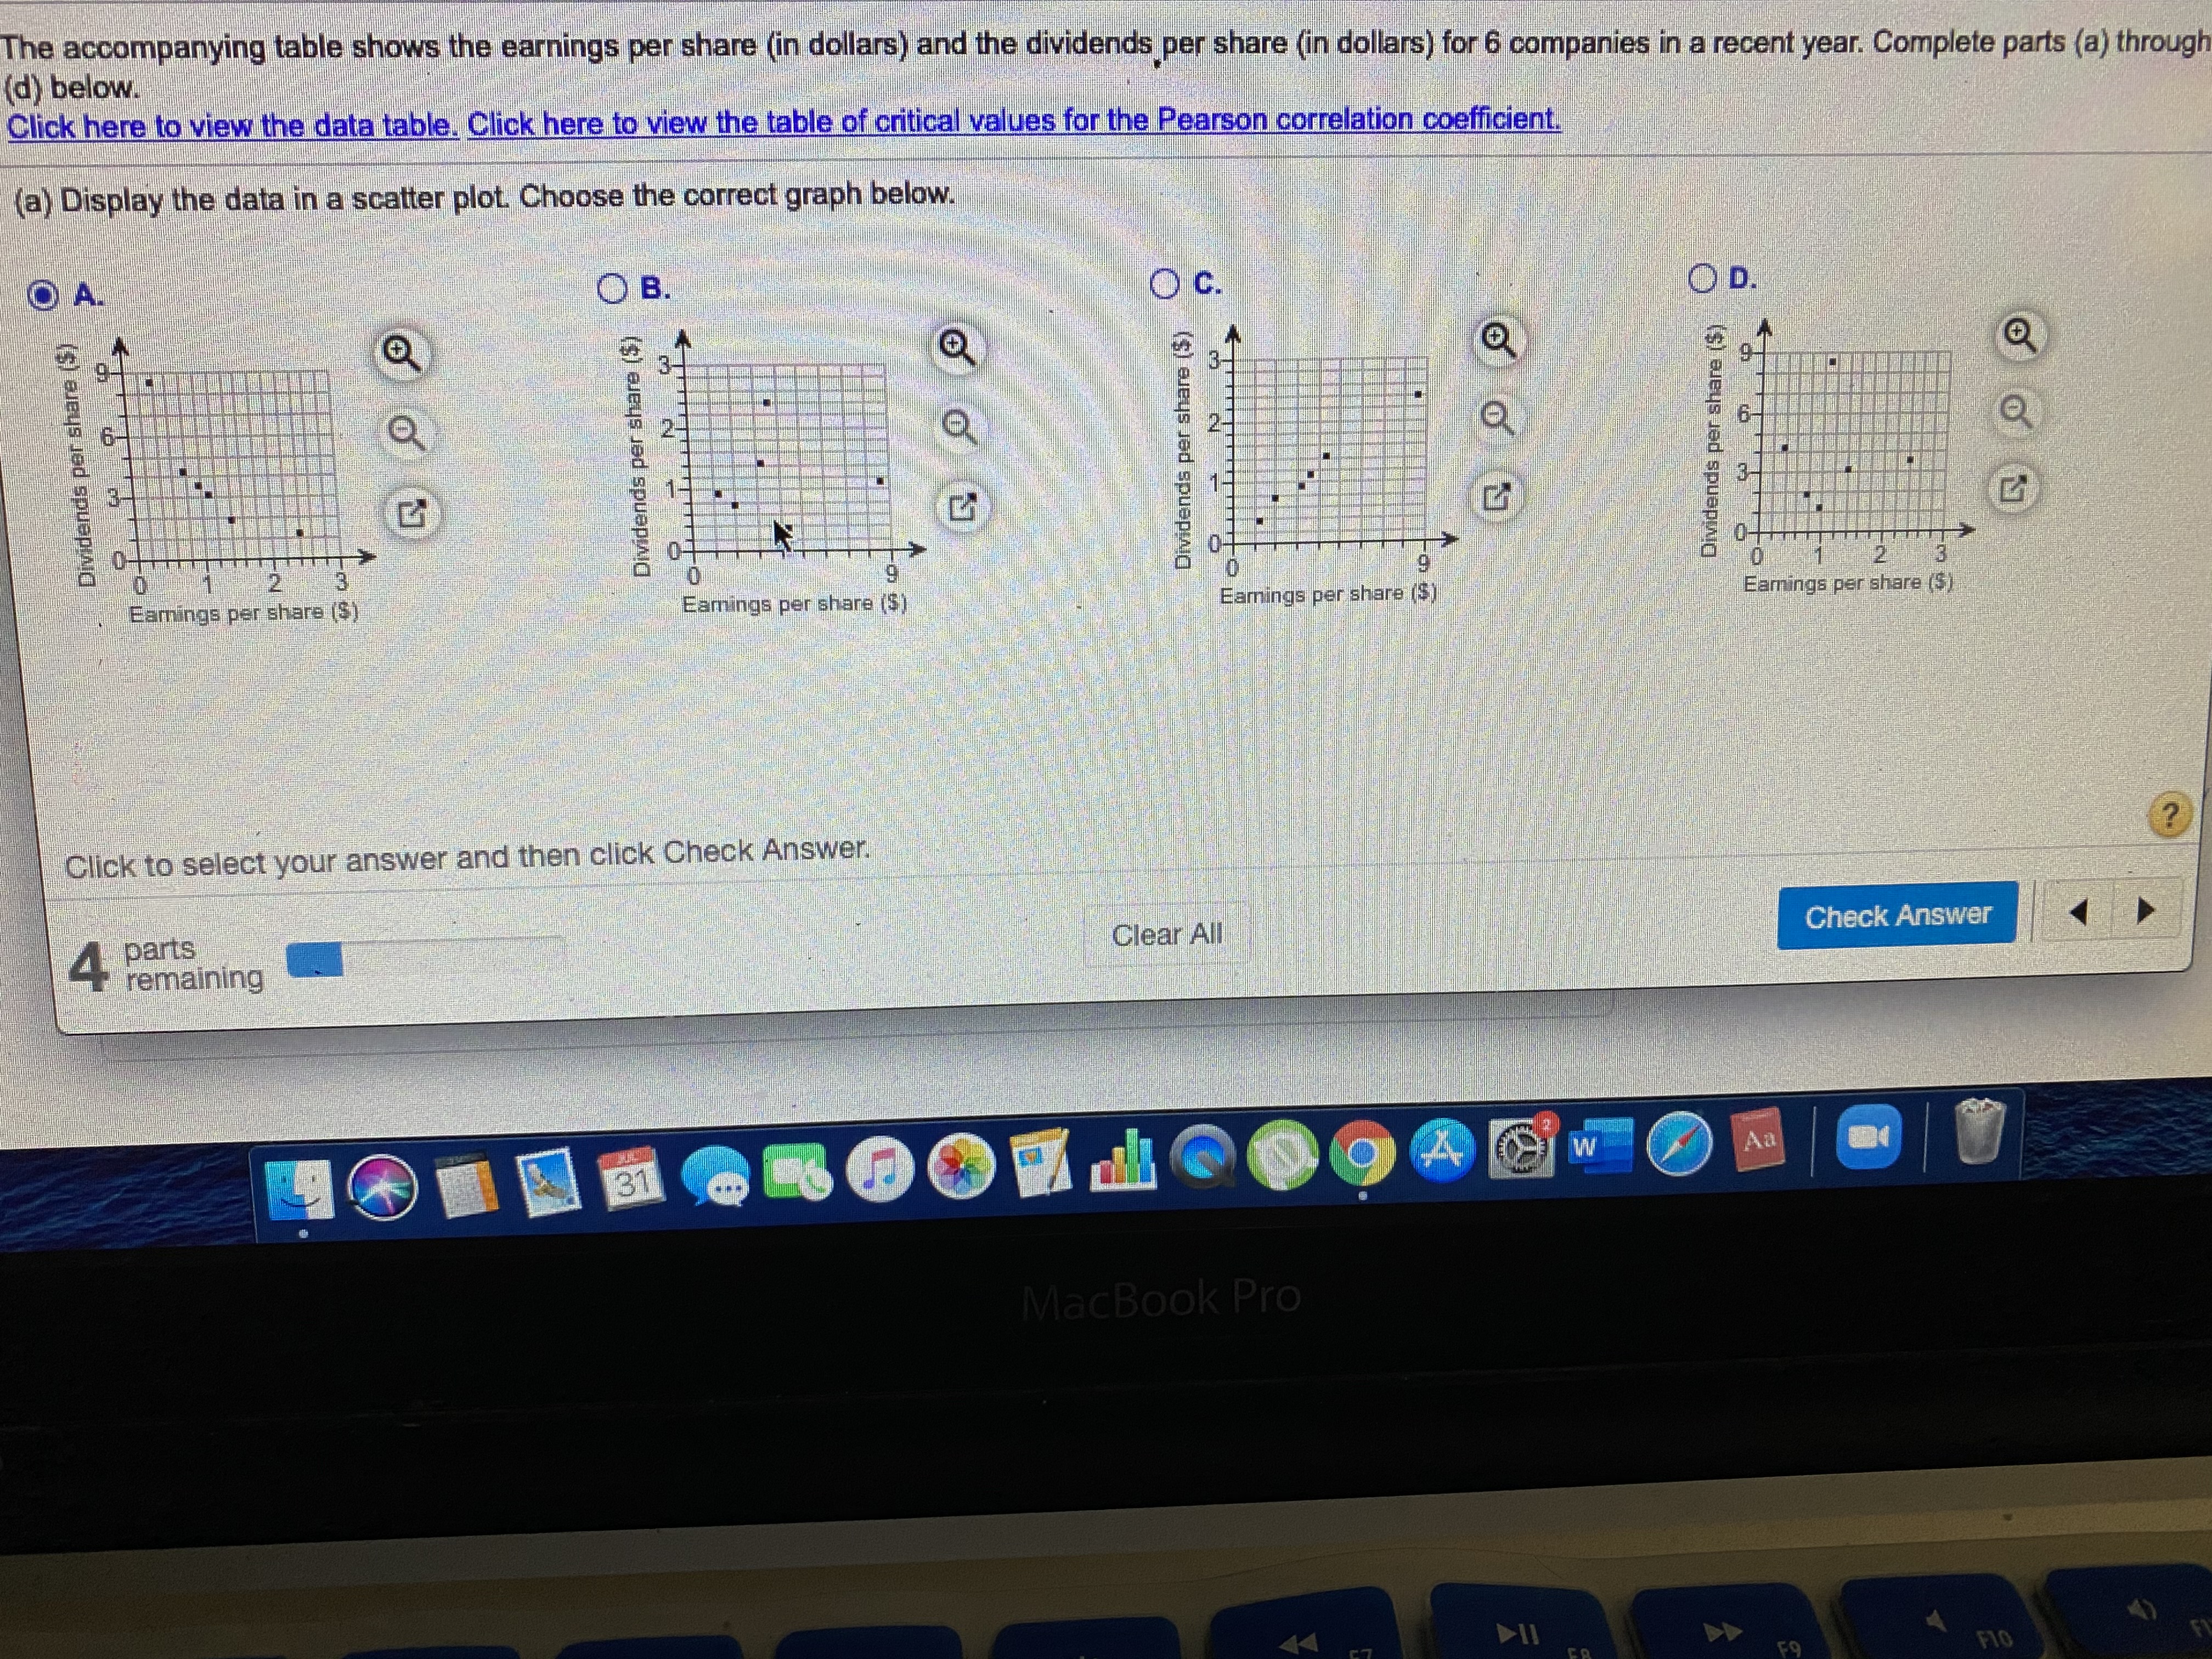
The accompanying table shows the earnings per share (in dollars) and the dividends per share (in dollars) for
6
companies in a recent year. Complete parts (a) through (d) below.Click here to view the data table.
Click here to view the table of critical values for the Pearson |
Earnings per share, x
|
Dividends per share, y
|
|
|---|---|---|
|
1.2
|
0.95
|
|
|
4.3
|
0.38
|
|
|
3.58
|
2.4
|
|
|
8.56
|
1.12
|
|
|
1.92
|
0.75
|
|
|
3.17
|
1.43
|
n alpha=0.05 alpha=0.01
4 0.95 0.99
5 0.878 0.959
6 0.811 0.917
7 0.754 0.875
8 0.707 0.834
9 0.666 0.798
10 0.632 0.765
11 0.602 0.735
12 0.576 0.708
13 0.553 0.684
14 0.532 0.661
15 0.514 0.641
16 0.497 0.623
17 0.482 0.606
18 0.468 0.59
19 0.456 0.575
20 0.444 0.561
21 0.433 0.549
22 0.423 0.537
23 0.413 0.526
24 0.404 0.515
25 0.396 0.505
26 0.388 0.496
27 0.381 0.487
28 0.374 0.479
29 0.367 0.471
30 0.361 0.463
35 0.334 0.43
40 0.312 0.403
45 0.294 0.38
50 0.279 0.361
55 0.266 0.345
60 0.254 0.33
65 0.244 0.317
70 0.235 0.306
75 0.227 0.296
80 0.22 0.286
85 0.213 0.278
90 0.207 0.27
95 0.202 0.263
100 0.197 0.256
(a) Display the data in a scatter plot . Choose the correct graph below.
A.
B.
C.
D.
The graphs are on the Image. choose the correct graph
(b) Calculate the sample correlation coefficient r.
r=
Round to three decimal places as needed.
(c) Describe the type of correlation, if any, and interpret the correlation in the context of the data. Pick the correct answer. A to G which one is right?
There is
linear correlation .
▼
a.a moderate negative
b.a strong negative
c.a perfect negative
d.a moderate positive
e.a perfect positive
f.a strong positive
g.no
(d)
A.
B.
C.
D.
E.
F.
Interpret the correlation. Choose the correct answer below.
As companies' earnings per share increase, their dividends per share tend to increase.
Increases in companies' earnings per share cause their dividends per share to increase.
As companies' earnings per share increase, their dividends per share tend to decrease.
Increases in companies' earnings per share cause their dividends per share to decrease.
Based on the correlation, there does not appear to be a linear relationship between companies' earnings per share and their dividends per share.
Based on the correlation, there does not appear to be any relationship between companies' earnings per share and their dividends per share.
(E)
(d) Use the table of critical values for the Pearson correlation coefficient to make a conclusion about the correlation coefficient. Let α=0.01.
Pick A or B and find the critical value
The critical value is= .Therefore, there
sufficient evidence at the
between companies' earnings per share and their dividends per share.
▼
A.isb.is not
1%
level of significance to conclude that
▼
A.there is no correlation
B.there is a significant linear correlation
(Round to three decimal places as needed.)

Expert Solution
This question has been solved!
Explore an expertly crafted, step-by-step solution for a thorough understanding of key concepts.

This is a popular solution

Trending nowThis is a popular solution!

Step by stepSolved in 3 steps with 2 images

Knowledge Booster


Learn more about
Need a deep-dive on the concept behind this application? Look no further. Learn more about this topic, statistics and related others by exploring similar questions and additional content below.Similar questions
- Pls help ASAP.arrow_forwardA person owes $1000 on a credit card that charges an interest rate of 2% per month. Complete this table showing the credit card balance each month if they do not make any payments. month total bill in dollars |1 1,000 12 1,020 3 1,040.40 14 5 7arrow_forwardA new laptop computer costs $15pp. The value of the computer decreases bye 22%each year. How much is the computer worth after 2 years? That is growth or decayarrow_forward
- What is the interest earned on a principle of $250 at 3% interest for 9 years? O $67.5 O $675 O $6750arrow_forwardUse the following information about Sunoco stock. 52 weeks VOL NET HI LO STOCK DIV YLD% P/E (1000s) CLOSE CHG 94.75 50.75 SUN 1.19 1.9 6 4588 61.37 +0.58 If you own 150 shares, how much in dividends did you make last year?arrow_forward7 1/2% of $800 is $?arrow_forward
- what is the FV of the investment. Round to nearest cent. $7,000 for 4 years at 4.75% annual interestarrow_forwardFind the total selling price for 5 shares of stocks at 90 1/8arrow_forwardCalculate the gross and net profits (in $) and the two profit margins (as %s) for the given company. (Round profit margins to the nearest tenth of a percent.) *chart attached with informaiton*arrow_forward
- The graph to the right shows total assets and total liabilities for a certain company in billions of dollars. Complete parts (a) through (c) below. 300 ... 250- (a) Shareholders' equity is a corporation's total assets minus total liabilities. Estimate the company's shareholders' equity in the year 2015. 200 Assets The equity is $ billion. 150- (Round to the nearest ten as needed.) 100- Liabilities 50 0- 2011 2012 2013 Year 2015 2014 Help Me Solve This View an Example Get More Help - Clear All Che arch ...* Assets and Liabilities (billions of dollars)arrow_forwardThe graph below shows the U.S. federal expenses for 2012. 3000- Interest All other departments and agencies Dollars (billions) 2000- 1000- Department of Defense Medicaid Medicare Other Social Security Mandatory spending Discretionary spending (a) Estimate the fraction of the total expenses that were spent on Medicare. Write your answer as the closest fraction whose denominator is 100. 100 000 00 100 100 100 100 (b) Estimate the fraction of the total expenses that were spent on Medicare and Medicaid. Write your answer as the closest fraction whose denominator is 100. 10 00000 100 20 100 30 100 40 100 100arrow_forwardWhat is the total amount if there is $100 that grows by 10.5% each year for 18 yearsarrow_forward
arrow_back_ios
SEE MORE QUESTIONS
arrow_forward_ios
Recommended textbooks for you
- MATLAB: An Introduction with ApplicationsStatisticsISBN:9781119256830Author:Amos GilatPublisher:John Wiley & Sons Inc
 Probability and Statistics for Engineering and th...StatisticsISBN:9781305251809Author:Jay L. DevorePublisher:Cengage Learning
 Statistics for The Behavioral Sciences (MindTap C...StatisticsISBN:9781305504912Author:Frederick J Gravetter, Larry B. WallnauPublisher:Cengage Learning
  Elementary Statistics: Picturing the World (7th E...StatisticsISBN:9780134683416Author:Ron Larson, Betsy FarberPublisher:PEARSON
 The Basic Practice of StatisticsStatisticsISBN:9781319042578Author:David S. Moore, William I. Notz, Michael A. FlignerPublisher:W. H. Freeman
 Introduction to the Practice of StatisticsStatisticsISBN:9781319013387Author:David S. Moore, George P. McCabe, Bruce A. CraigPublisher:W. H. Freeman
MATLAB: An Introduction with Applications
Statistics
ISBN:9781119256830
Author:Amos Gilat
Publisher:John Wiley & Sons Inc
Probability and Statistics for Engineering and th...
Statistics
ISBN:9781305251809
Author:Jay L. Devore
Publisher:Cengage Learning
Statistics for The Behavioral Sciences (MindTap C...
Statistics
ISBN:9781305504912
Author:Frederick J Gravetter, Larry B. Wallnau
Publisher:Cengage Learning
Elementary Statistics: Picturing the World (7th E...
Statistics
ISBN:9780134683416
Author:Ron Larson, Betsy Farber
Publisher:PEARSON
The Basic Practice of Statistics
Statistics
ISBN:9781319042578
Author:David S. Moore, William I. Notz, Michael A. Fligner
Publisher:W. H. Freeman
Introduction to the Practice of Statistics
Statistics
ISBN:9781319013387
Author:David S. Moore, George P. McCabe, Bruce A. Craig
Publisher:W. H. Freeman