MATLAB: An Introduction with Applications
6th Edition
ISBN: 9781119256830
Author: Amos Gilat
Publisher: John Wiley & Sons Inc
expand_more
expand_more
format_list_bulleted
Question

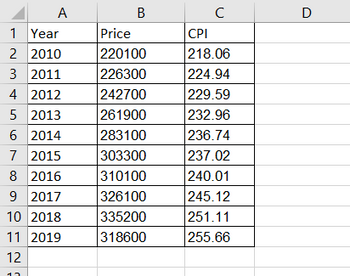
Transcribed Image Text:A
1
Year
2 2010
3 2011
4
2012
5 2013
6 2014
7 2015
8 2016
9 2017
10 2018
11 2019
12
17
B
Price
220100
226300
242700
261900
283100
303300
310100
326100
335200
318600
с
CPI
218.06
224.94
229.59
232.96
236.74
237.02
240.01
245.12
251.11
255.66
D

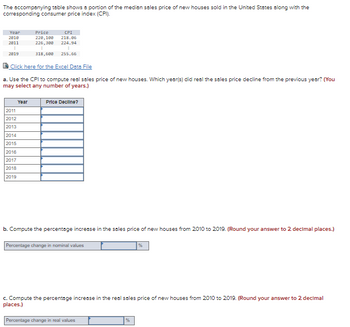
Transcribed Image Text:The accompanying table shows a portion of the median sales price of new houses sold in the United States along with the
corresponding consumer price index (CPI).
Year
Price
CPI
220,108 218.86
2010
2011
226,308
224.94
E
E
2819
318,600
255.66
Click here for the Excel Data File
a. Use the CPI to compute real sales price of new houses. Which year(s) did real the sales price decline from the previous year? (You
may select any number of years.)
Year
Price Decline?
2011
2012
2013
2014
2015
2016
2017
2018
2019
b. Compute the percentage increase in the sales price of new houses from 2010 to 2019. (Round your answer to 2 decimal places.)
Percentage change in nominal values
%
c. Compute the percentage increase in the real sales price of new houses from 2010 to 2019. (Round your answer to 2 decimal
places.)
Percentage change in real values
%
Expert Solution
This question has been solved!
Explore an expertly crafted, step-by-step solution for a thorough understanding of key concepts.
Step by stepSolved in 3 steps

Knowledge Booster
Similar questions
- Calculate the average inventory (in $) and inventory turnover ratio for the given company. (Round the inventory turnover ratio to one decimal place.)arrow_forwardCalculate the percentage change in sugar consumption between 1800 and 2000?arrow_forwardThe number of married people in a country (in millions) and the total number of adults in the country (in millions) are provided in the accompanying table for several years. Find the percentage of people married in each of the given years, and describe the trend over time. Year Married Total 1990 110.4 187.4 1997 120.2 205.5 2000 122.1 215.4 2007 130.5 238.6 The percentage of the adult population that was married in 1990 was nothing%. (Round to one decimal place as needed.)arrow_forward
- A price relative was computed for houses. The base period is 2005. The price relative in 2010 was 130. The interpretation of the price relative is that a. there has been a 130% increase in the price of houses from 2005 to 2010. b. there has been a 30% increase in the price of houses from 2005 to 2010. c. the price of houses in 2010 was $130 higher than the price in 2005. d. It is impossible to interpret the index.arrow_forwardMany factors influence the retail price of gasoline. Suppose the following table shows the average retail price for a gallon of regular grade gasoline for each year from 2011 through 2014. (Round your answers to one decimal place.) Year Average Price ($) 2011 3.526 2012 3.608 2013 3.505 2014 3.368 (a) Use 2011 as the base year and develop a price index for the retail price of a gallon of regular grade gasoline over this four-year period. 2011 price index 2012 price index 2013 price index 2014 price index (b) Use 2012 as the base year and develop a price index for the retail price of a gallon of regular grade gasoline over this four-year period. 2011 price index 2012 price index 2013 price index 2014 price indexarrow_forwardSuppose you needed $16,000 to maintain a particular standard of living in 1979. How much would you have needed in 1997 to maintain the same standard Average Annual Consumer Price Index (CPI) (1982-1984=100) CPI of living? Assume that all prices have risen at the same rate as the CPI. Year Year CPI Year CPI 103.9 152.4 1984 1985 1986 1987 1988 1989 1990 1991 1992 1993 1994 1973 44.4 1995 How much would you have needed? 107.6 1996 1997 1974 49.3 1975 1976 1977 156.9 160.5 163.0 53.8 109.6 56.9 113.6 1998 (Round to the nearest dollar.) 60.6 118.3 1999 166.6 1978 1979 1980 1981 1982 1983 172.2 177.1 2000 2001 2002 2003 2004 2005 65.2 124.0 72.6 130.7 82.4 90.9 96.5 99.6 136.2 140.3 144.5 148.2 179.9 184.0 188.9 195.3 On-Screen Keyboard Esc %23 1 2. * 3 4 8 Hom Tab q u i Del End e yarrow_forward
- A market researcher at a major clothing company that has traditionally relied on catalog mail-order sales decides to investigate whether the amount of online sales has changed. She compares the mean monthly online sales of the past several months with a historical figure for mean monthly sales for online purchases. She gets a P-value of 0.07. Explain in this context what the 7% represents.arrow_forwardDescribe the differences between a nominal and an ordinal scale.arrow_forwardI'm running out of questions. Can I pay for 30 more extra?arrow_forward
- Fill in the blanks in the following table. Round your answers to 2 decimal places.arrow_forwardMany factors influence the retail price of gasoline. Suppose the following table shows the average retail price for a gallon of regular grade gasoline for each year from 2011 through 2014. (Round your answers to one decimal place.) Year Average Price ($) 2011 3.511 2012 3.623 2013 3.500 2014 3.363 (a) Use 2011 as the base year and develop a price index for the retail price of a gallon of regular grade gasoline over this four-year period. 2011 price index 2012 price index 2013 price index 2014 price index (b) Use 2012 as the base year and develop a price index for the retail price of a gallon of regular grade gasoline over this four-year period. 2011 price index 2012 price index 2013 price index 2014 price indexarrow_forward2. Which of the following statements is false? Explain your answer. A. A price index can be used to compare changes in prices over time. B. A graph of the average monthly price of gas is an example of an index. C. Price index values are often calculated relative to a base value at a certain point in time or in a certain place. D. Index values can be greater than 100.arrow_forward
arrow_back_ios
SEE MORE QUESTIONS
arrow_forward_ios
Recommended textbooks for you
 MATLAB: An Introduction with ApplicationsStatisticsISBN:9781119256830Author:Amos GilatPublisher:John Wiley & Sons Inc
 Probability and Statistics for Engineering and th...StatisticsISBN:9781305251809Author:Jay L. DevorePublisher:Cengage Learning
 Statistics for The Behavioral Sciences (MindTap C...StatisticsISBN:9781305504912Author:Frederick J Gravetter, Larry B. WallnauPublisher:Cengage Learning
 Elementary Statistics: Picturing the World (7th E...StatisticsISBN:9780134683416Author:Ron Larson, Betsy FarberPublisher:PEARSON
 The Basic Practice of StatisticsStatisticsISBN:9781319042578Author:David S. Moore, William I. Notz, Michael A. FlignerPublisher:W. H. Freeman
 Introduction to the Practice of StatisticsStatisticsISBN:9781319013387Author:David S. Moore, George P. McCabe, Bruce A. CraigPublisher:W. H. Freeman

MATLAB: An Introduction with Applications
Statistics
ISBN:9781119256830
Author:Amos Gilat
Publisher:John Wiley & Sons Inc

Probability and Statistics for Engineering and th...
Statistics
ISBN:9781305251809
Author:Jay L. Devore
Publisher:Cengage Learning

Statistics for The Behavioral Sciences (MindTap C...
Statistics
ISBN:9781305504912
Author:Frederick J Gravetter, Larry B. Wallnau
Publisher:Cengage Learning

Elementary Statistics: Picturing the World (7th E...
Statistics
ISBN:9780134683416
Author:Ron Larson, Betsy Farber
Publisher:PEARSON

The Basic Practice of Statistics
Statistics
ISBN:9781319042578
Author:David S. Moore, William I. Notz, Michael A. Fligner
Publisher:W. H. Freeman

Introduction to the Practice of Statistics
Statistics
ISBN:9781319013387
Author:David S. Moore, George P. McCabe, Bruce A. Craig
Publisher:W. H. Freeman