MATLAB: An Introduction with Applications
6th Edition
ISBN: 9781119256830
Author: Amos Gilat
Publisher: John Wiley & Sons Inc
expand_more
expand_more
format_list_bulleted
Question

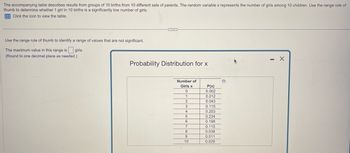
Transcribed Image Text:The accompanying table describes results from groups of 10 births from 10 different sets of parents. The random variable x represents the number of girls among 10 children. Use the range rule of
thumb to determine whether 1 girl in 10 births is a significantly low number of girls.
Click the icon to view the table.
Use the range rule of thumb to identify a range of values that are not significant.
The maximum value in this range is girls.
(Round to one decimal place as needed.)
***
Probability Distribution for x
Number of
Girls x
0
1
2
3
4
5
6
7
8
9
10
P(x)
0.002
0.012
0.043
0.115
0.203
0.234
0.198
0.115
0.038
0.011
0.029
D
-
X
Expert Solution
This question has been solved!
Explore an expertly crafted, step-by-step solution for a thorough understanding of key concepts.
Step by stepSolved in 4 steps with 9 images

Knowledge Booster
Similar questions
- of the data. This measure is all the data points and dividing by the total number of data points. The mean describes an entire sample with a single number that represents the calculated byarrow_forwardRaymond wants to estimate the percentage of parents that use cloth diapers. He asks a randomly selected group of 200 parents whether or not they use cloth diapers. What is the data?arrow_forwardPlease do A and Barrow_forward
- What is the name of the test used?arrow_forwardtou want to see if it makes a difference which lane to be in when there is traffic. You randomly observe 328 cars pass by on the four lane freeway. The results are displayed in the table below. Use a level of significance of a 010 a. Complete the rest of the table by filling in the expected frequencies: Frequency of Cars in Each Lane Outcome Frequency Expected Frequency Lane 1 94 Lane 2 63 Lane 3 101 Lane 4 70 b. What is the correct statistical test to use? Select an answer v c. What are the null and alternative hypotheses? Ho: The traffic and lanes are independent. The distribution of traffic is not uniform. The traffic and lanes are dependent. The distribution of traffic is uniform.arrow_forwardThe heights, in inches, of the four members of a barbershop quartet of singers are listed below. 72,68,67,73 Find the population variance for this data set. Round to one decimal place if necessary.arrow_forward
- 20 computer screens were randomly selected from a large collection of computer screens in a company’s warehouse. These 20 computer screens are referred to as the: test statistic. parameter. population. sample.arrow_forwardHere are the reading scores (out of 60) of 20 randomly selected kindergarten kids in a district 34, 26, 46, 46, 43, 42, 45, 39, 43, 32, 15, 36, 29, 39, 41, 27, 38, 58, 31, 35 Find the 5-number summary for the data set. Min: 15 Q1: OF 58 Find the IQR of the data set. IQR: 11.7 x Find Q3+1.5(IQR).! Q3+1.5(IQR) = 60.6 X Median: 38.5 38.5 Q3: 43 043 Max: 58 Are there any high outliers, that is, are there any numbers in the data set higher than Q3+1.5(IQR)? No, there are no high outliers ✓ OB Find Q₁-1.5(IQR). Q₁-1.5(IQR) Are there any low outliers, that is, are there any numbers in the data set higher than Q₁— 1.5(IQR)? No, there are no low outliers ✓ = 25.3 Xarrow_forwardu refers to the population mean while x refers to the sample mean O A. True O B. False ts ft or 2arrow_forward
- Find the mean, the median, and the mode(s), if any, for the given data. Round noninteger means to the nearest tenth. (If there is more than one mode, enter your answer as a comma-separated list. If an answer does not exist, enter DNE.) −8.5, −2.4, 4.7, 4.7, 6.4, 8.9, 9.9arrow_forwardFind the median and lower quartile of the number of wins of the Mariners for 6 years. Years and wins below: 2010/2011/2012/2013/2014/2015 71 61 72 86 89 95 A) Find the median. Show work. B) Find the lower quartile. Show work.arrow_forwardPlease help with D E F Please Help with D E Farrow_forward
arrow_back_ios
SEE MORE QUESTIONS
arrow_forward_ios
Recommended textbooks for you
 MATLAB: An Introduction with ApplicationsStatisticsISBN:9781119256830Author:Amos GilatPublisher:John Wiley & Sons Inc
 Probability and Statistics for Engineering and th...StatisticsISBN:9781305251809Author:Jay L. DevorePublisher:Cengage Learning
 Statistics for The Behavioral Sciences (MindTap C...StatisticsISBN:9781305504912Author:Frederick J Gravetter, Larry B. WallnauPublisher:Cengage Learning
 Elementary Statistics: Picturing the World (7th E...StatisticsISBN:9780134683416Author:Ron Larson, Betsy FarberPublisher:PEARSON
 The Basic Practice of StatisticsStatisticsISBN:9781319042578Author:David S. Moore, William I. Notz, Michael A. FlignerPublisher:W. H. Freeman
 Introduction to the Practice of StatisticsStatisticsISBN:9781319013387Author:David S. Moore, George P. McCabe, Bruce A. CraigPublisher:W. H. Freeman

MATLAB: An Introduction with Applications
Statistics
ISBN:9781119256830
Author:Amos Gilat
Publisher:John Wiley & Sons Inc

Probability and Statistics for Engineering and th...
Statistics
ISBN:9781305251809
Author:Jay L. Devore
Publisher:Cengage Learning

Statistics for The Behavioral Sciences (MindTap C...
Statistics
ISBN:9781305504912
Author:Frederick J Gravetter, Larry B. Wallnau
Publisher:Cengage Learning

Elementary Statistics: Picturing the World (7th E...
Statistics
ISBN:9780134683416
Author:Ron Larson, Betsy Farber
Publisher:PEARSON

The Basic Practice of Statistics
Statistics
ISBN:9781319042578
Author:David S. Moore, William I. Notz, Michael A. Fligner
Publisher:W. H. Freeman

Introduction to the Practice of Statistics
Statistics
ISBN:9781319013387
Author:David S. Moore, George P. McCabe, Bruce A. Craig
Publisher:W. H. Freeman