
MATLAB: An Introduction with Applications
6th Edition
ISBN: 9781119256830
Author: Amos Gilat
Publisher: John Wiley & Sons Inc
expand_more
expand_more
format_list_bulleted
Related questions
infoPractice Pack
Question
infoPractice Pack
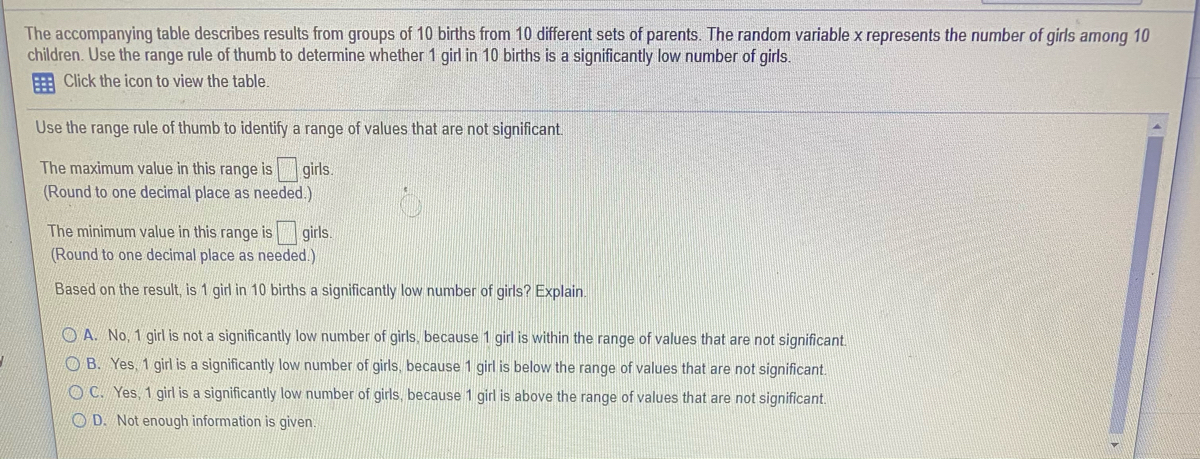

Transcribed Image Text:The accompanying table describes results from groups of 10 births from 10 different sets of parents. The random variable x represents the number of girls among 10
children. Use the range rule of thumb to determine whether 1 girl in 10 births is a significantly low number of girls.
E Click the icon to view the table.
Use the range rule of thumb to identify a range of values that are not significant.
The maximum value in this range isgirls.
(Round to one decimal place as needed.)
The minimum value in this range is girls.
(Round to one decimal place as needed.)
Based on the result, is 1 girl in 10 births a significantly low number of girls? Explain.
O A. No, 1 girl is not a significantly low number of girls, because 1 girl is within the range of values that are not significant.
O B. Yes, 1 girl is a significantly low number of girls, because 1 girl is below the range of values that are not significant.
O C. Yes, 1 girl is a significantly low number of girls, because 1 girl is above the range of values that are not significant.
O D. Not enough information is given.

Transcribed Image Text:Number of
Girls x
P(x)
0.003
0.016
2.
0.045
3
0.116
4
0.198
0.239
0.207
0.116
8.
0.039
9.
0.011
10
0.010
Print
Done
DELL
Expert Solution
This question has been solved!
Explore an expertly crafted, step-by-step solution for a thorough understanding of key concepts.

Includes step-by-step video

Learn your wayIncludes step-by-step video

Step by stepSolved in 2 steps with 2 images

Knowledge Booster


Learn more about
Need a deep-dive on the concept behind this application? Look no further. Learn more about this topic, statistics and related others by exploring similar questions and additional content below.Similar questions
- Use the RAND function to assign random numbers to each observation. Then copy the 2 columns and paste them to the right. Then sort the data by the random number. Observation - 91,32,36,70,93,42,65,80,68,73,52,29,95,55,94,46,92,49,4,66,21,97arrow_forwardAnswer asaparrow_forwardTyped plz and asap Please provide MW me a quality solution show all steps and calculations take Care of plagiqrism alsoarrow_forward
- The average fruit fly will lay 377 eggs into rotting fruit. A biologist wants to see if the average will be greater for flies that have a certain gene modified. The data below shows the number of eggs that were laid into rotting fruit by several fruit flies that had this gene modified. Assume that the distribution of the population is normal. 367, 374, 364, 388, 407, 369, 375, 362, 403, 383, 381, 391, 371 What can be concluded at the the αα = 0.10 level of significance level of significance? The test statistic = (please show your answer to 3 decimal places.) The p-value = (Please show your answer to 4 decimal places.)arrow_forwardnumber 23 please :)arrow_forwardFind the sample variances of the data sets A and B given below. A:3, 4, 6,7, 10 B:-20, 5, 15, 24arrow_forward
- Use the dataset below to fill in the blanks. The space between the data and the blanks isprovided so that you can show each data value's deviation and each data value's deviation squared.Sixteen families were selected at random and the number of children in each was recorded 0 0 0 1 1 2 2 2 2 2 3 3 4 6 8 12arrow_forwardThe average fruit fly will lay 375 eggs into rotting fruit. A biologist wants to see if the average will be greater for flies that have a certain gene modified. The data below shows the number of eggs that were laid into rotting fruit by several fruit flies that had this gene modified. Assume that the distribution of the population is normal. 379, 406, 378, 394, 369, 369, 402, 383, 367, 357, 401, 407, 357, 394, 367 What can be concluded at the the a = 0.05 level of significance level of significance? a. For this study, we should use t-test for a population mean b. The null and alternative hypotheses would be: Ho: H1: C. The test statistic (please show your answer to 3 decimal places.) d. The p-value (Please show your answer %D to 4 decimal places.)arrow_forward
arrow_back_ios
arrow_forward_ios
Recommended textbooks for you
- MATLAB: An Introduction with ApplicationsStatisticsISBN:9781119256830Author:Amos GilatPublisher:John Wiley & Sons Inc
 Probability and Statistics for Engineering and th...StatisticsISBN:9781305251809Author:Jay L. DevorePublisher:Cengage Learning
 Statistics for The Behavioral Sciences (MindTap C...StatisticsISBN:9781305504912Author:Frederick J Gravetter, Larry B. WallnauPublisher:Cengage Learning
  Elementary Statistics: Picturing the World (7th E...StatisticsISBN:9780134683416Author:Ron Larson, Betsy FarberPublisher:PEARSON
 The Basic Practice of StatisticsStatisticsISBN:9781319042578Author:David S. Moore, William I. Notz, Michael A. FlignerPublisher:W. H. Freeman
 Introduction to the Practice of StatisticsStatisticsISBN:9781319013387Author:David S. Moore, George P. McCabe, Bruce A. CraigPublisher:W. H. Freeman
MATLAB: An Introduction with Applications
Statistics
ISBN:9781119256830
Author:Amos Gilat
Publisher:John Wiley & Sons Inc
Probability and Statistics for Engineering and th...
Statistics
ISBN:9781305251809
Author:Jay L. Devore
Publisher:Cengage Learning
Statistics for The Behavioral Sciences (MindTap C...
Statistics
ISBN:9781305504912
Author:Frederick J Gravetter, Larry B. Wallnau
Publisher:Cengage Learning
Elementary Statistics: Picturing the World (7th E...
Statistics
ISBN:9780134683416
Author:Ron Larson, Betsy Farber
Publisher:PEARSON
The Basic Practice of Statistics
Statistics
ISBN:9781319042578
Author:David S. Moore, William I. Notz, Michael A. Fligner
Publisher:W. H. Freeman
Introduction to the Practice of Statistics
Statistics
ISBN:9781319013387
Author:David S. Moore, George P. McCabe, Bruce A. Craig
Publisher:W. H. Freeman