MATLAB: An Introduction with Applications
6th Edition
ISBN: 9781119256830
Author: Amos Gilat
Publisher: John Wiley & Sons Inc
expand_more
expand_more
format_list_bulleted
Question
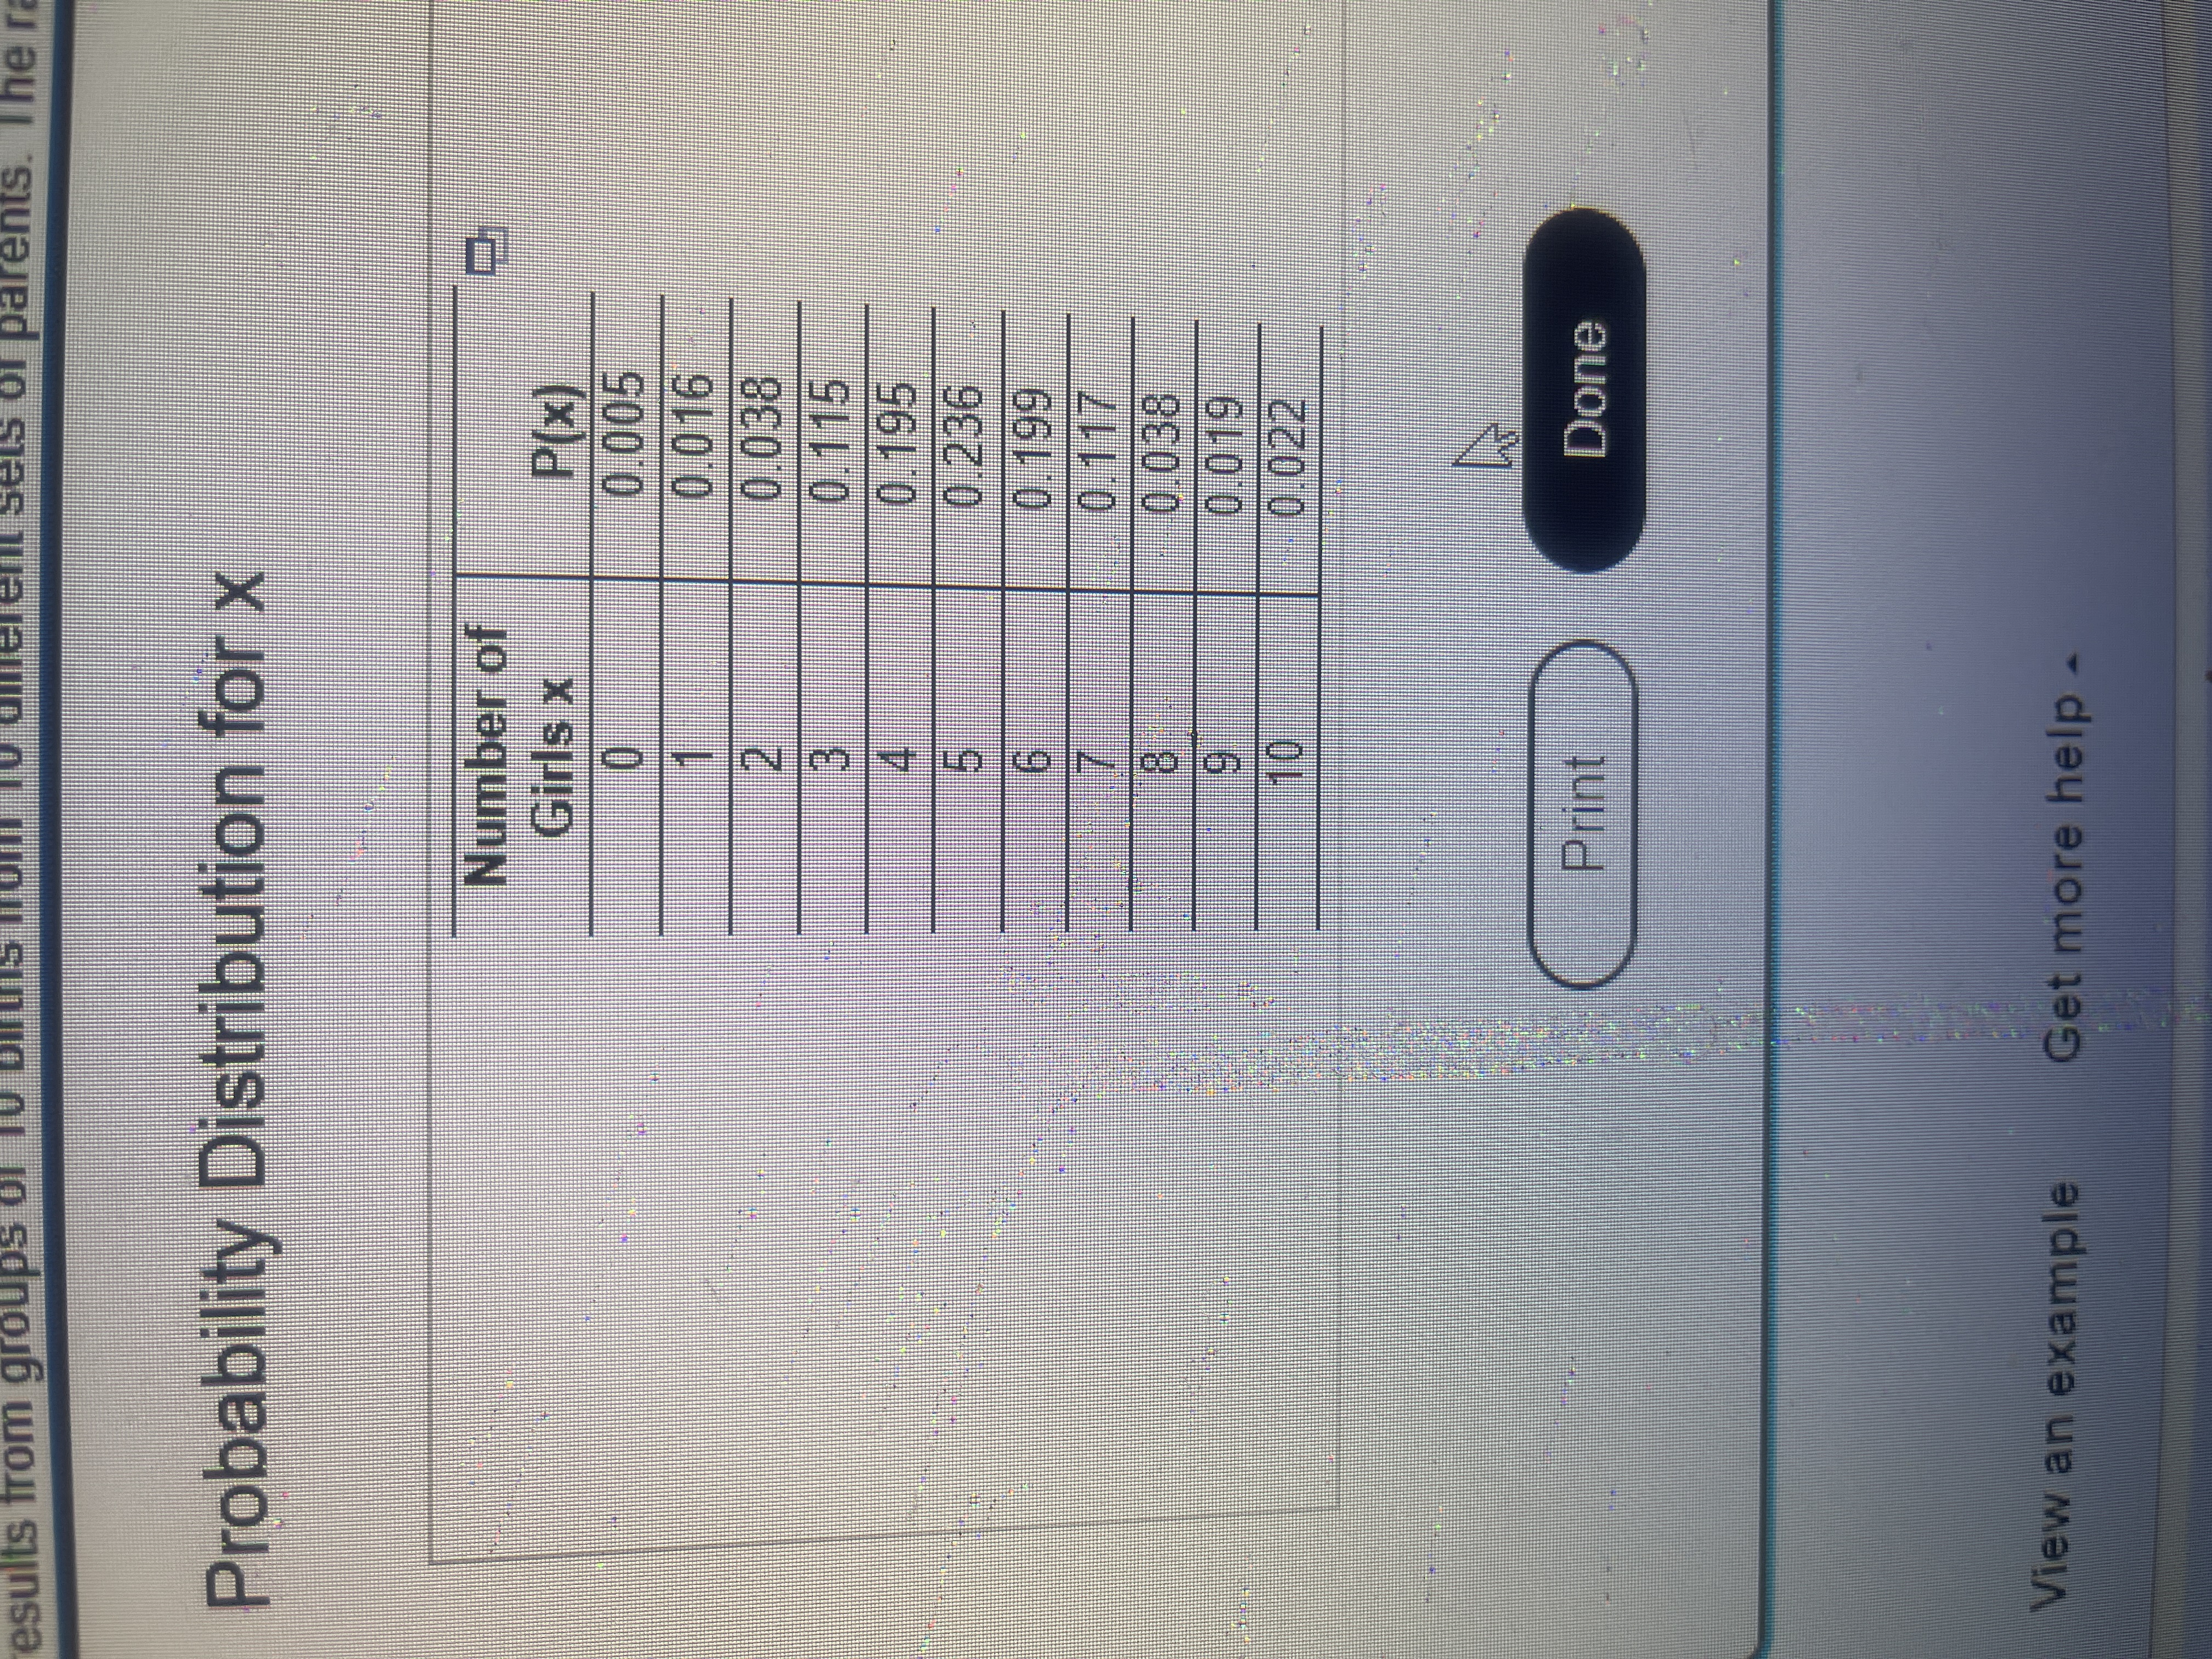
The accompanying table descibes results from groups of 10 births from 10 different sets of parents. The random variable x represents the number of girls among 10 children. Use the
Use the range of thumb to identify a range of values that are significant
the maximum value in this range is ___ girls .
(round to one decimal place as needed).
The minimum value in this range is ___ girls .
(round to one decimal place as needed ).
Based on the result is 1 girl in 10 births a significantly low number of girls ? Explain .

Transcribed Image Text:of parents. The ra
Probability Distribution for x
Number of
Girls x
0.016
0.038
0.115
0.195
0.236
1.
2.
3.
5.
6.
0.117
0.038
8.
6.
019
0.022
10
Print
Done
View an example
Get more help.
Expert Solution
This question has been solved!
Explore an expertly crafted, step-by-step solution for a thorough understanding of key concepts.
This is a popular solution
Trending nowThis is a popular solution!
Step by stepSolved in 2 steps with 3 images

Knowledge Booster
Similar questions
- The table summarizes results from 985 pedestrian deaths that were caused by automobile accidents. Driver Pedestrian Intoxicated? Intoxicated? Yes No Yes 57 72 No 242 614 If one of the pedestrian deaths is randomly selected, find the probability that neither the pedestrian nor the driver was intoxicated. Please enter a decimal to 2 places. Probability =arrow_forwardWhat is assigned randomly?arrow_forwardAbout 3% of the population has a particular genetic mutation. 900 people are randomly selected.Find the mean for the number of people with the genetic mutation in such groups of 900.arrow_forward
- Assume that 900 births are randomly selected and 443 of the births are girls. Use subjective judgment to describe the number of girls as significantly high, significantly low, or neither significantly low nor significantly high.arrow_forwardUse flat random numbers to estimate .arrow_forwardDogsled drivers, known as mushers, use several different breeds of dogs to pull their sleds. One proponent of Siberian Huskies believes that sleds pulled by Siberian Huskies are faster than sleds pulled by other breeds. He times 4040 teams of Siberian Huskies on a particular short course, and they have a mean time of 7.77.7 minutes. The mean time on the same course for 4747 teams of other breeds of sled dogs is 6.26.2 minutes. Assume that the times on this course have a population standard deviation of 1.51.5 minutes for teams of Siberian Huskies and 1.61.6 minutes for teams of other breeds of sled dogs. Let Population 1 be sleds pulled by Siberian Huskies and let Population 2 be sleds pulled by other breeds. Step 1 of 2 : Construct a 95%95% confidence interval for the true difference between the mean times on this course for teams of Siberian Huskies and teams of other breeds of sled dogs. Round the endpoints of the interval to one decimal place, if necessary.arrow_forward
- About 2% of the population has a particular genetic mutation. 900 people are randomly selected. Find the mean for the number of people with the genetic mutation in such groups of 900.arrow_forwardCompute the mean weight of a sample of seven chickens selected at random from a large poultry. the chickens weigh: 8,12,9,11.5,8.5,9.5,10( pounds)arrow_forwardAbout 4% of the population has a particular genetic mutation. 600 people are randomly selected. Find the mean for the number of people with the genetic mutation in such groups of 600. Submit Question acerarrow_forward
arrow_back_ios
arrow_forward_ios
Recommended textbooks for you
 MATLAB: An Introduction with ApplicationsStatisticsISBN:9781119256830Author:Amos GilatPublisher:John Wiley & Sons Inc
 Probability and Statistics for Engineering and th...StatisticsISBN:9781305251809Author:Jay L. DevorePublisher:Cengage Learning
 Statistics for The Behavioral Sciences (MindTap C...StatisticsISBN:9781305504912Author:Frederick J Gravetter, Larry B. WallnauPublisher:Cengage Learning
 Elementary Statistics: Picturing the World (7th E...StatisticsISBN:9780134683416Author:Ron Larson, Betsy FarberPublisher:PEARSON
 The Basic Practice of StatisticsStatisticsISBN:9781319042578Author:David S. Moore, William I. Notz, Michael A. FlignerPublisher:W. H. Freeman
 Introduction to the Practice of StatisticsStatisticsISBN:9781319013387Author:David S. Moore, George P. McCabe, Bruce A. CraigPublisher:W. H. Freeman

MATLAB: An Introduction with Applications
Statistics
ISBN:9781119256830
Author:Amos Gilat
Publisher:John Wiley & Sons Inc

Probability and Statistics for Engineering and th...
Statistics
ISBN:9781305251809
Author:Jay L. Devore
Publisher:Cengage Learning

Statistics for The Behavioral Sciences (MindTap C...
Statistics
ISBN:9781305504912
Author:Frederick J Gravetter, Larry B. Wallnau
Publisher:Cengage Learning

Elementary Statistics: Picturing the World (7th E...
Statistics
ISBN:9780134683416
Author:Ron Larson, Betsy Farber
Publisher:PEARSON

The Basic Practice of Statistics
Statistics
ISBN:9781319042578
Author:David S. Moore, William I. Notz, Michael A. Fligner
Publisher:W. H. Freeman

Introduction to the Practice of Statistics
Statistics
ISBN:9781319013387
Author:David S. Moore, George P. McCabe, Bruce A. Craig
Publisher:W. H. Freeman