ENGR.ECONOMIC ANALYSIS
14th Edition
ISBN: 9780190931919
Author: NEWNAN
Publisher: Oxford University Press
expand_more
expand_more
format_list_bulleted
Question
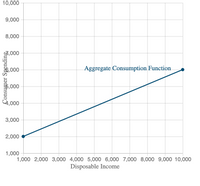
The accompanying graph represents the aggregate consumption function for the small island nation of Pineapple Paradise. The people of Pineapple Paradise expect their future disposable income to increase. Use the graph to show an increase in consumption expenditures.
What is the new level of aggregate autonomous consumer spending?
1 $1000
2 $3000
3 $2000
4 $4000

Transcribed Image Text:10,000
9,000
8,000
67,000
5,000
Aggregate Consumption Function
5,000
4,000
3,000
2,000
1,000
1,000 2,000 3,000 4,000 5,000 6,000 7,000 8,000 9,000 10,000
Disposable Income
Çonsumer Spending,
Expert Solution
This question has been solved!
Explore an expertly crafted, step-by-step solution for a thorough understanding of key concepts.
This is a popular solution
Trending nowThis is a popular solution!
Step by stepSolved in 2 steps

Knowledge Booster
Learn more about
Need a deep-dive on the concept behind this application? Look no further. Learn more about this topic, economics and related others by exploring similar questions and additional content below.Similar questions
- Calculate the equilibrium income by using the consumption function formula. 1. Y =C 2. Y= C+I 3. Y = C+I+G 4. Y= C+I+G+Nx Given: C = 100; I = 150; G = 100; m= 50; x=35; change in DY = 900; change in C = 630arrow_forwardTOPIC: Consumption and Savingarrow_forwardSuppose that an economy consists of only two individuals. Trevor has $1150 available to spend on goods. He decides to purchase $210 worth of produce from Juanita in the current quarter. No other economic activity takes place during the current quarter. Using this information, answer the questions. For the current quarter, what is the economy's income? $ For the current quarter, what is the economy's expenditure? In an economy, how are income and expenditure related? Income is greater than expenditure. O Income is less than expenditure. They are unrelated. O They are equal.arrow_forward
- Suppose there is some hypothetical economy in which households spend $0.50 of each additional dollar they earn and save the $0.50 they have left over. The following graph plots the economy's initial aggregate demand curve (AD1AD1). Suppose now that the government increases its purchases by $3.5 billion. Use the green line (triangle symbol) on the following graph to show the aggregate demand curve (AD2AD2) after the multiplier effect takes place. Hint: Be sure the new aggregate demand curve (AD2AD2) is parallel to AD1AD1. You can see the slope of AD1AD1 by selecting it on the following graph The following graph plots equilibrium in the money market at an interest rate of 6% and a quantity of money equal to $60 billion. Show the impact of the increase in government purchases on the interest rate by shifting one or both of the curves on the following graph. Suppose that for every increase in the interest rate of one percentage point, the level of investment…arrow_forwardPlease answer the correct question please ASAP Don't answer by pen paper please explainarrow_forwardWhich of the following is true: a) at equilibrium aggregate expenditure is greater than gross domestic expenditure. b) at equilibrium GDP is greater than gross domestic expenditure. c) at equilibrium aggregate expenditure is smaller than gross domestic expenditure. d) at equilibrium GDP is smaller than gross domestic expenditure or e) at equilibrium both aggregate expenditure and GDP are smaller than gross domestic expenditurearrow_forward
- 7. Question 3. The consumption function Consider the hypothetical country of Kejimkujik. Suppose that national income in Kejimkujik is $12 billion, households pay $4 billion in taxes, household consumption is equal to $6 billion, and the marginal propensity to consume (MPC) is 0.625. On the following graph, use the blue line (circle symbol) to plot the economy's consumption function. CONSUMPTION (Billions of dollars) 20 18 16 14 12 10 8 OF 6 4 2 0 6 8 10 12 14 16 DISPOSABLE INCOME (Billions of dollars). 18 20 Consumption Functionarrow_forwardTOPIC: Comparing total expenditures and total productionarrow_forwardConsider the hypothetical country of Kejimkujik. Suppose that national income in Kejimkujik is $300 billion, households pay $100 billion in taxes, household consumption is equal to $160 billion, and the marginal propensity to consume (MPC) is 0.6. On the following graph, use the blue line (circle symbol) to plot the economy's consumption function. Consumption Function050100150200250300350400450500500450400350300250200150100500CONSUMPTION (Billions of dollars)DISPOSABLE INCOME (Billions of dollars) Suppose now that Kejimkujik’s national income increases to $330 billion. Assuming the amount paid in taxes is fixed at $100 billion and that MPC = 0.6, what is the new amount of household consumption? $148 billion $219.4 billion $220.6 billion $178 billionarrow_forward
arrow_back_ios
SEE MORE QUESTIONS
arrow_forward_ios
Recommended textbooks for you

 Principles of Economics (12th Edition)EconomicsISBN:9780134078779Author:Karl E. Case, Ray C. Fair, Sharon E. OsterPublisher:PEARSON
 Engineering Economy (17th Edition)EconomicsISBN:9780134870069Author:William G. Sullivan, Elin M. Wicks, C. Patrick KoellingPublisher:PEARSON
 Principles of Economics (MindTap Course List)EconomicsISBN:9781305585126Author:N. Gregory MankiwPublisher:Cengage Learning
 Managerial Economics: A Problem Solving ApproachEconomicsISBN:9781337106665Author:Luke M. Froeb, Brian T. McCann, Michael R. Ward, Mike ShorPublisher:Cengage Learning
 Managerial Economics & Business Strategy (Mcgraw-...EconomicsISBN:9781259290619Author:Michael Baye, Jeff PrincePublisher:McGraw-Hill Education


Principles of Economics (12th Edition)
Economics
ISBN:9780134078779
Author:Karl E. Case, Ray C. Fair, Sharon E. Oster
Publisher:PEARSON

Engineering Economy (17th Edition)
Economics
ISBN:9780134870069
Author:William G. Sullivan, Elin M. Wicks, C. Patrick Koelling
Publisher:PEARSON

Principles of Economics (MindTap Course List)
Economics
ISBN:9781305585126
Author:N. Gregory Mankiw
Publisher:Cengage Learning

Managerial Economics: A Problem Solving Approach
Economics
ISBN:9781337106665
Author:Luke M. Froeb, Brian T. McCann, Michael R. Ward, Mike Shor
Publisher:Cengage Learning

Managerial Economics & Business Strategy (Mcgraw-...
Economics
ISBN:9781259290619
Author:Michael Baye, Jeff Prince
Publisher:McGraw-Hill Education