
MATLAB: An Introduction with Applications
6th Edition
ISBN: 9781119256830
Author: Amos Gilat
Publisher: John Wiley & Sons Inc
expand_more
expand_more
format_list_bulleted
Related questions
Concept explainers
Topic Video
Question
The accompanying data represent the annual rates of return of two companies' stock for the past 12 years. Complete parts (a) through (k).
Year Rate of Return of Company 1 Rate of Return of Company 2
1996 0.203 0.398
1997 0.310 0.510
1998 0.267 0.410
1999 0.195 0.436
2000 -0.101 -0.060
2001 -0.130 -0.151
2002 -0.234 -0.357
2003 0.264 0.328
2004 0.090 0.207
2005 0.030 -0.014
2006 0.128 0.093
2007 -0.035 0.027
(j) Plot residuals against the rate of return of Company 1. Does the residual plot confirm that the relation between the rate of return of Company 1 and Company 2 is linear? Yes or No?
(k) Are there any years where the rate of return of Company 2 was unusual? Yes or No?
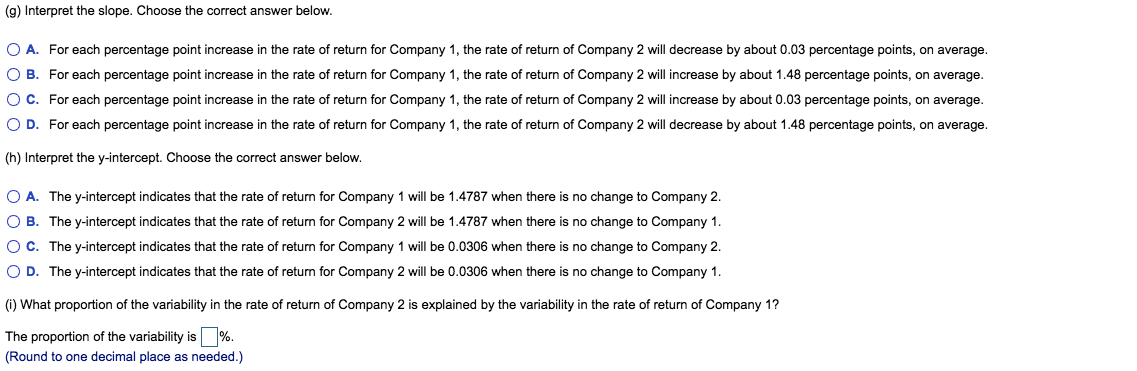

Transcribed Image Text:(g) Interpret the slope. Choose the correct answer below.
O A. For each percentage point increase in the rate of return for Company 1, the rate of return of Company 2 will decrease by about 0.03 percentage points, on average.
O B. For each percentage point increase in the rate of return for Company 1, the rate of return of Company 2 will increase by about 1.48 percentage points, on average.
OC. For each percentage point increase in the rate of return for Company 1, the rate of return of Company 2 will increase by about 0.03 percentage points, on average.
O D. For each percentage point increase in the rate of return for Company 1, the rate of return of Company 2 will decrease by about 1.48 percentage points, on average.
(h) Interpret the y-intercept. Choose the correct answer below.
O A. The y-intercept indicates that the rate of return for Company 1 will be 1.4787 when there is no change to Company 2.
O B. The y-intercept indicates that the rate of return for Company 2 will be 1.4787 when there is no change to Company 1.
OC. The y-intercept indicates that the rate of return for Company 1 will be 0.0306 when there is no change to Company 2.
O D. The y-intercept indicates that the rate of return for Company 2 will be 0.0306 when there is no change to Company 1.
(i) What proportion of the variability in the rate of return of Company 2 is explained by the variability in the rate of return of Company 1?
The proportion of the variability is%.
(Round to one decimal place as needed.)

Transcribed Image Text:(b) Determine the correlation coefficient between rate of return of Company 1 and Company 2.
The correlation coefficient is
(Round to three decimal places as needed.)
(c) Based on the scatter diagram and correlation coefficient, is there a linear relation between rate of return of Company 1 and Company 2?
Yes
No
(d) Find the least-squares regression line treating the rate of return of Company 1 as the explanatory variable. Choose the correct answer below.
y = 0.0306x + 1.4787
y = 1.4787x -0.0306
y = 1.4787x +0.0306
O V = - 1.4787x +0.0306
(e) Predict the rate of return of Company 2 if the rate of return of Company 1 is 0.15 (15%).
The rate of return of Company 2 will be
(Round to four decimal places as needed.)
(f) If the actual rate of return for Company 2 was 20.0% when the rate of return of Company 1 was 15%, was the performance of Company 2 above or below average among all years the
returns of Company 1 were 15%?
Expert Solution
This question has been solved!
Explore an expertly crafted, step-by-step solution for a thorough understanding of key concepts.

This is a popular solution

Trending nowThis is a popular solution!

Step by stepSolved in 2 steps with 1 images

Knowledge Booster


Learn more about
Need a deep-dive on the concept behind this application? Look no further. Learn more about this topic, statistics and related others by exploring similar questions and additional content below.Similar questions
- 5. How is the flow of investors' money into stock mutual funds related to the flow of money into bond mutual funds? Data are collected on the net new money flowing into stock and bond mutual funds in the years 1985 to 2000, in billions of dollars. "Net" means that funds flowing out are subtracted from those flowing in. If more money leaves than arrives, the net flow will be negative. To eliminate the effect of inflation, all dollar amounts are in "real dollars" with constant buying power equal to that of a dollar in the year 2000. Below is Minitab output for a regression line using the stock values as the explanatory variable. Regression Analysis: Bonds versus Stocks The regression equation is Bonds = 53.4 - 0.196 Stocks Predictor Coef SE Coef T P Constant 53.41 22.99 2.32 0.036 Stocks -0.1962 0.1550 -1.27 0.226 S= 59.8813 R-Sq = 10.3% R-Sq(adj) = 3.9% (a) What is the conclusion from a test of the slope of the regression line at the 0.05 significance level? Recall that the hypotheses…arrow_forwardJames has an investment worth $175,609.50. The investment will make a special payment of X to James in 1 month from today and the investment also will make regular, fixed monthly payments of $1,440.00 to James forever. The expected return for the investment is 1.23 percent per month and the first regular, fixed monthly payment of $1,440.00 will be made to James in one month from today. What is X, the amount of the special payment that will be made to James in 1 month? An amount less than $58,600.00 or an anmount greater than $179,600.00 An amount equal to or greater than $58,600.00 but less than $88,950.00 An amount equal to or greater than $88,950.00 but less than $146,400.00 An amount equal to or greater than $146,400.00 but less than $176,000.00 O An amount equal to or greater than $176,000.00 but less than $179,600.00 Com SHEMAarrow_forwardSuppose that $25,000 from a retirement account is invested in a large cap stock fund. After 25 yr, the value is $177,774.94. Part: 0/2 Part 1 of 2 (a) Use the model A=Pe to determine the average rate of return under continuous compounding. Round to the nearest tenth of a percent. Avoid rounding in intermediate steps. The average rate is approximately %. Xarrow_forward
arrow_back_ios
arrow_forward_ios
Recommended textbooks for you
- MATLAB: An Introduction with ApplicationsStatisticsISBN:9781119256830Author:Amos GilatPublisher:John Wiley & Sons Inc
 Probability and Statistics for Engineering and th...StatisticsISBN:9781305251809Author:Jay L. DevorePublisher:Cengage Learning
 Statistics for The Behavioral Sciences (MindTap C...StatisticsISBN:9781305504912Author:Frederick J Gravetter, Larry B. WallnauPublisher:Cengage Learning
  Elementary Statistics: Picturing the World (7th E...StatisticsISBN:9780134683416Author:Ron Larson, Betsy FarberPublisher:PEARSON
 The Basic Practice of StatisticsStatisticsISBN:9781319042578Author:David S. Moore, William I. Notz, Michael A. FlignerPublisher:W. H. Freeman
 Introduction to the Practice of StatisticsStatisticsISBN:9781319013387Author:David S. Moore, George P. McCabe, Bruce A. CraigPublisher:W. H. Freeman
MATLAB: An Introduction with Applications
Statistics
ISBN:9781119256830
Author:Amos Gilat
Publisher:John Wiley & Sons Inc
Probability and Statistics for Engineering and th...
Statistics
ISBN:9781305251809
Author:Jay L. Devore
Publisher:Cengage Learning
Statistics for The Behavioral Sciences (MindTap C...
Statistics
ISBN:9781305504912
Author:Frederick J Gravetter, Larry B. Wallnau
Publisher:Cengage Learning
Elementary Statistics: Picturing the World (7th E...
Statistics
ISBN:9780134683416
Author:Ron Larson, Betsy Farber
Publisher:PEARSON
The Basic Practice of Statistics
Statistics
ISBN:9781319042578
Author:David S. Moore, William I. Notz, Michael A. Fligner
Publisher:W. H. Freeman
Introduction to the Practice of Statistics
Statistics
ISBN:9781319013387
Author:David S. Moore, George P. McCabe, Bruce A. Craig
Publisher:W. H. Freeman