
MATLAB: An Introduction with Applications
6th Edition
ISBN: 9781119256830
Author: Amos Gilat
Publisher: John Wiley & Sons Inc
expand_more
expand_more
format_list_bulleted
Related questions
Question

Transcribed Image Text:**Educational Content: Median Household Income Hypothesis Testing**
**Context:**
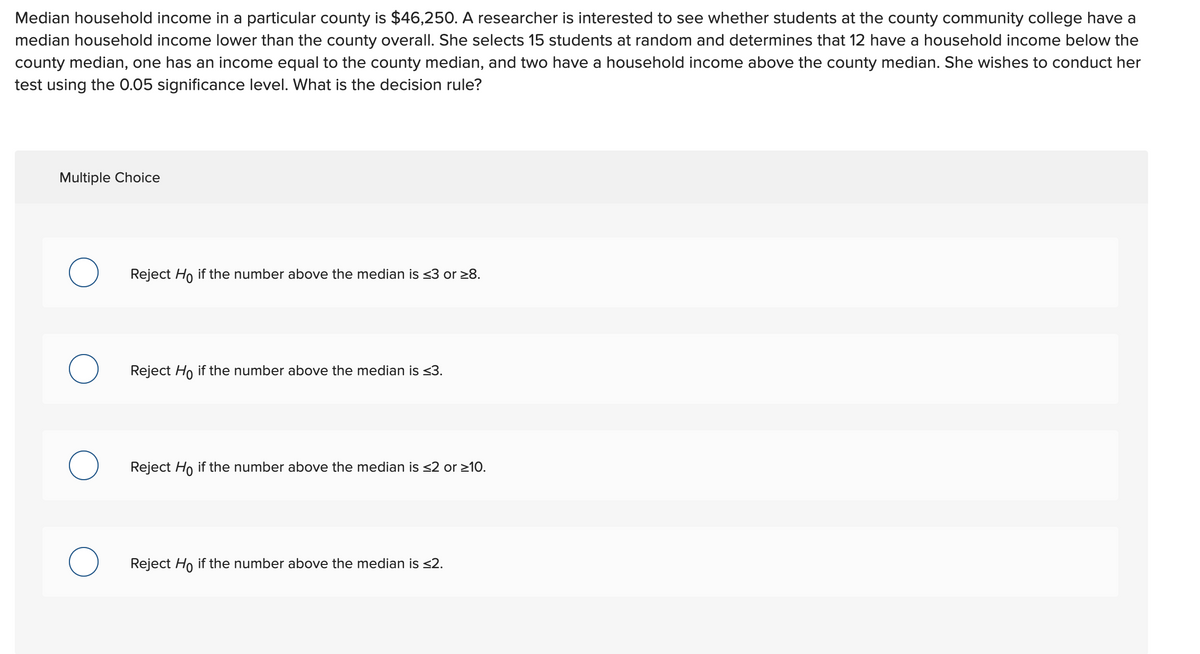
In a particular county, the median household income is $46,250. A researcher is interested in determining whether the students at a local community college have a median household income significantly lower than the county's median. She selects a random sample of 15 students and finds the following distribution:
- 12 students have a household income below the county median.
- 1 student has an income equal to the county median.
- 2 students have a household income above the county median.
The researcher conducts a hypothesis test using a significance level of 0.05. The question is: **What is the decision rule for this test?**
**Multiple Choice:**
1. **Option A:** Reject \( H_0 \) if the number above the median is \( \leq 3 \) or \( \geq 8 \).
2. **Option B:** Reject \( H_0 \) if the number above the median is \( \leq 3 \).
3. **Option C:** Reject \( H_0 \) if the number above the median is \( \leq 2 \) or \( \geq 10 \).
4. **Option D:** Reject \( H_0 \) if the number above the median is \( \leq 2 \).
In this context, \( H_0 \) represents the null hypothesis that there is no difference between the median incomes of the college students and the county overall. The decision rule will guide whether this hypothesis should be rejected based on the sample data and set significance level.
Expert Solution
This question has been solved!
Explore an expertly crafted, step-by-step solution for a thorough understanding of key concepts.

This is a popular solution

Trending nowThis is a popular solution!

Step by stepSolved in 2 steps with 1 images

Knowledge Booster

Similar questions
- Helparrow_forwardUsing the General Social Survey of 2012, determine if there is sufficient evidence to infer that the average American watches more than 24 hours per week, which is 3 hours per day (TVHOURS). Use a 5% significance level for all tests.ONLY USE EXCEL AND PLEASE SHOW ALL STEPS AND EXCEL COMMANDS. ?0:?=3 ?1:?>3 ID AGE SEX DEGREE HRS1 WRKSLF TVHOURS 55088 22 1 3 15 2 1 55089 21 1 1 30 2 55090 42 1 1 60 2 55091 49 2 1 2 4 55092 70 2 3 2 3 55093 50 2 3 2 4 55094 35 2 2 2 3 55095 24 2 0 55096 28 2 0 55097 28 2 3 40 2 55098 55 1 0 2 6 55099 36 2 3 20 2 55100 28 2 1 55101 59 2 1 2 2 55102 52 1 0 32 2 2 55103 35 2 1 53 2 55104 36 1 1 60 2 2 55105 47 2 1 40 2 3 55106 55 1 1 40 2 55107 18 2 1 5 55108 76 2 0 2 55109 39 1 0 12 2 55110 54 1 2 40 2 3 55111 45 2 2 40 2 0 55112 71 1 1 2 2 55113 42 2 3 75 2 55114 22 1 1 40 2 2 55115 50 1 0 8 55116 81 2 3 2 4 55117 44 2 1…arrow_forwardWhich statement is true with regard to non-response bias? 1.Respondents have strong opinions about the subject matter. 2.Respondents change their answers to influence the results. 3.Respondents give the answer they think the questioner wants. 4.Respondents do not give their honest opinion.arrow_forward
- Help I need in An hour thankyouarrow_forwardPlease do not give solution in image formate thanku. A school psychologist wants to determine if reprimanding in public (in front of the class) or private is more effective for curbing behavior. He randomly selects 12 students whose teachers reprimand in private and 12 students whose teachers reprimand in public. At the end of the year he determines the number of misbehaviors for each student. For the public condition and mean=7.7 and s=4.1 for the private condition mean=4.2 and s=3.5. Which method is more effective? What is the percentage of variance accounted for by the method of reprimand? What is the power of your test?arrow_forwardMonthly telephone charges for cell phone in the United States are normally distributed with a mean of $62 for a single user. Coach Keefer thinks that leasing smart phones has increased the monthly cell phone bill for a single user. H: μ- 62 H : μ 62 O Ho : µ= 62 H : μ> 62 O Ho : µ= 62 H : μ 62 a O Ho : 62 Ha : ữ + 62arrow_forward
- Need help finding test statistic and p-value. See the photo for problem.arrow_forwardThe data represents the number of points received in a quiz. 9, 9, 10, 10, 10, 1 Mean- 8.166... Median- 9.5 What is a better measure of center? The mean or median and why?arrow_forwardUse the display of data to find the mean, median, mode, and midrange. Q 9 10 11 12 13 14 15 16 8 Score The mean of the data is (Round to the nearest tenth as needed.) The median of the data is (Round to the nearest tenth as needed.) Select the correct choice below and, if necessary, fill in the answer box to complete your choice. Aouenbelarrow_forward
arrow_back_ios
arrow_forward_ios
Recommended textbooks for you
- MATLAB: An Introduction with ApplicationsStatisticsISBN:9781119256830Author:Amos GilatPublisher:John Wiley & Sons Inc
 Probability and Statistics for Engineering and th...StatisticsISBN:9781305251809Author:Jay L. DevorePublisher:Cengage Learning
 Statistics for The Behavioral Sciences (MindTap C...StatisticsISBN:9781305504912Author:Frederick J Gravetter, Larry B. WallnauPublisher:Cengage Learning
  Elementary Statistics: Picturing the World (7th E...StatisticsISBN:9780134683416Author:Ron Larson, Betsy FarberPublisher:PEARSON
 The Basic Practice of StatisticsStatisticsISBN:9781319042578Author:David S. Moore, William I. Notz, Michael A. FlignerPublisher:W. H. Freeman
 Introduction to the Practice of StatisticsStatisticsISBN:9781319013387Author:David S. Moore, George P. McCabe, Bruce A. CraigPublisher:W. H. Freeman
MATLAB: An Introduction with Applications
Statistics
ISBN:9781119256830
Author:Amos Gilat
Publisher:John Wiley & Sons Inc
Probability and Statistics for Engineering and th...
Statistics
ISBN:9781305251809
Author:Jay L. Devore
Publisher:Cengage Learning
Statistics for The Behavioral Sciences (MindTap C...
Statistics
ISBN:9781305504912
Author:Frederick J Gravetter, Larry B. Wallnau
Publisher:Cengage Learning
Elementary Statistics: Picturing the World (7th E...
Statistics
ISBN:9780134683416
Author:Ron Larson, Betsy Farber
Publisher:PEARSON
The Basic Practice of Statistics
Statistics
ISBN:9781319042578
Author:David S. Moore, William I. Notz, Michael A. Fligner
Publisher:W. H. Freeman
Introduction to the Practice of Statistics
Statistics
ISBN:9781319013387
Author:David S. Moore, George P. McCabe, Bruce A. Craig
Publisher:W. H. Freeman