
MATLAB: An Introduction with Applications
6th Edition
ISBN: 9781119256830
Author: Amos Gilat
Publisher: John Wiley & Sons Inc
expand_more
expand_more
format_list_bulleted
Related questions
Question
What is the test statistic and P value?
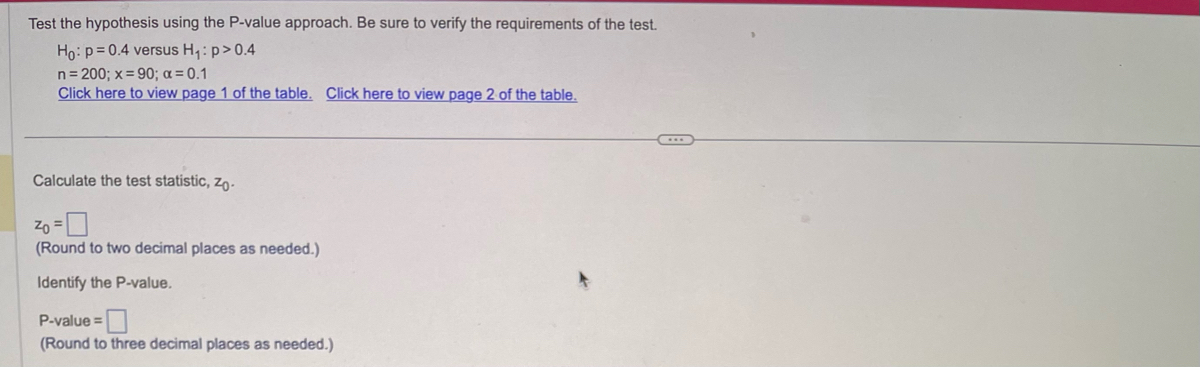

Transcribed Image Text:Test the hypothesis using the P-value approach. Be sure to verify the requirements of the test.
Ho: p=0.4 versus H₁: p > 0.4
n = 200; x = 90; α = 0.1
Click here to view page 1 of the table. Click here to view page 2 of the table.
Calculate the test statistic, Zo-
Zo
(Round to two decimal places as needed.)
Identify the P-value.
P-value=
(Round to three decimal places as needed.)
Expert Solution
This question has been solved!
Explore an expertly crafted, step-by-step solution for a thorough understanding of key concepts.

This is a popular solution

Trending nowThis is a popular solution!

Step by stepSolved in 3 steps

Knowledge Booster

Similar questions
- Claim: Most adults would erase all of their personal information online if they could. A software firm survey of 696 randomly selected adults showed that 62% of them would erase all of their personal information online if they could. Find the value of the test statistic. The value of the test statistic isarrow_forwardThe Bureau of Labor Statistics reports that the official unemployment rate for Black people was 10.4% and 4.7% for White people in February 2015. Select all correct answers for this question. O The samples of white and black people are independent. The explanatory variable is the unemployment rate. The response variable is the unemployment rate. The response variable is race.arrow_forwardClaim: Most adults would erase all of their personal information online if they could. A software firm survey of 671randomly selected adults showed that 58% of them would erase all of their personal information online if they could. Find the value of the test statistic. The value of the test statistic isarrow_forward
- Channing Tatum wants to know: is the average height between veterans and non-veterans different? What test should he use? One Sample T-Test Paired T-Test Two sample t test, after checking for equal variance Two Sample T-Testarrow_forwardThink about doing an Independent-Measures ANOVA, Step 3. If the data are as follows, find the SS-between. GROUP 1 GROUP 2 GROUP 3 1 3 5 3 2 7 2 4 6 A) SS-between = 26.00 B) SS-between = 42.00 C) SS-between = 6.00 D) SS-between = 13.00arrow_forwardClaim: Most adults would erase all of their personal information online if they could. A software firm survey of 475 randomly selected adults showed that 57% of them would erase all of their personal information online if they could. Find the value of the test statistic.arrow_forward
- A researcher wants to know if peoples standardized test performance is influenced by what they are wearing. They ask 16 ppl to take the SAT while wearing their best professional outfit. 6 months later they have the same 16 ppl take the SAT while wearing a bathing suit. What test would you use and why? (z test, independent t test, single sample t test, paired samples)arrow_forwardPerforming a statistical analysis on managers and employees, and we need to determine whether the data is "significant" enough to consider the two groups to have different levels of desirability. How is the level of significance, p = 0.05, set?arrow_forwardClaim: Most adults would erase all of their personal information online if they could. A software firm survey of 404 randomly selected adults showed that 65% of them would erase all of their personal information online if they could. Find the value of the test statistic.arrow_forward
arrow_back_ios
arrow_forward_ios
Recommended textbooks for you
- MATLAB: An Introduction with ApplicationsStatisticsISBN:9781119256830Author:Amos GilatPublisher:John Wiley & Sons Inc
 Probability and Statistics for Engineering and th...StatisticsISBN:9781305251809Author:Jay L. DevorePublisher:Cengage Learning
 Statistics for The Behavioral Sciences (MindTap C...StatisticsISBN:9781305504912Author:Frederick J Gravetter, Larry B. WallnauPublisher:Cengage Learning
  Elementary Statistics: Picturing the World (7th E...StatisticsISBN:9780134683416Author:Ron Larson, Betsy FarberPublisher:PEARSON
 The Basic Practice of StatisticsStatisticsISBN:9781319042578Author:David S. Moore, William I. Notz, Michael A. FlignerPublisher:W. H. Freeman
 Introduction to the Practice of StatisticsStatisticsISBN:9781319013387Author:David S. Moore, George P. McCabe, Bruce A. CraigPublisher:W. H. Freeman
MATLAB: An Introduction with Applications
Statistics
ISBN:9781119256830
Author:Amos Gilat
Publisher:John Wiley & Sons Inc
Probability and Statistics for Engineering and th...
Statistics
ISBN:9781305251809
Author:Jay L. Devore
Publisher:Cengage Learning
Statistics for The Behavioral Sciences (MindTap C...
Statistics
ISBN:9781305504912
Author:Frederick J Gravetter, Larry B. Wallnau
Publisher:Cengage Learning
Elementary Statistics: Picturing the World (7th E...
Statistics
ISBN:9780134683416
Author:Ron Larson, Betsy Farber
Publisher:PEARSON
The Basic Practice of Statistics
Statistics
ISBN:9781319042578
Author:David S. Moore, William I. Notz, Michael A. Fligner
Publisher:W. H. Freeman
Introduction to the Practice of Statistics
Statistics
ISBN:9781319013387
Author:David S. Moore, George P. McCabe, Bruce A. Craig
Publisher:W. H. Freeman